
'''
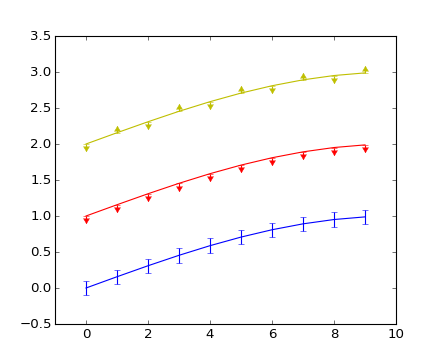
Illustration of upper and lower limit symbols on errorbars
'''
from math import pi
from numpy import array, arange, sin
import pylab as P
fig = P.figure()
x = arange(10.0)
y = sin(arange(10.0)/20.0*pi)
P.errorbar(x,y,yerr=0.1,capsize=3)
y = sin(arange(10.0)/20.0*pi) + 1
P.errorbar(x,y,yerr=0.1, uplims=True)
y = sin(arange(10.0)/20.0*pi) + 2
upperlimits = array([1,0]*5)
lowerlimits = array([0,1]*5)
P.errorbar(x, y, yerr=0.1, uplims=upperlimits, lolims=lowerlimits)
P.xlim(-1,10)
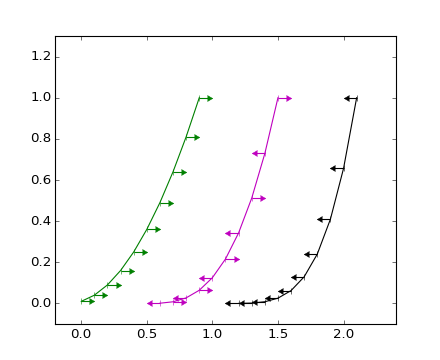
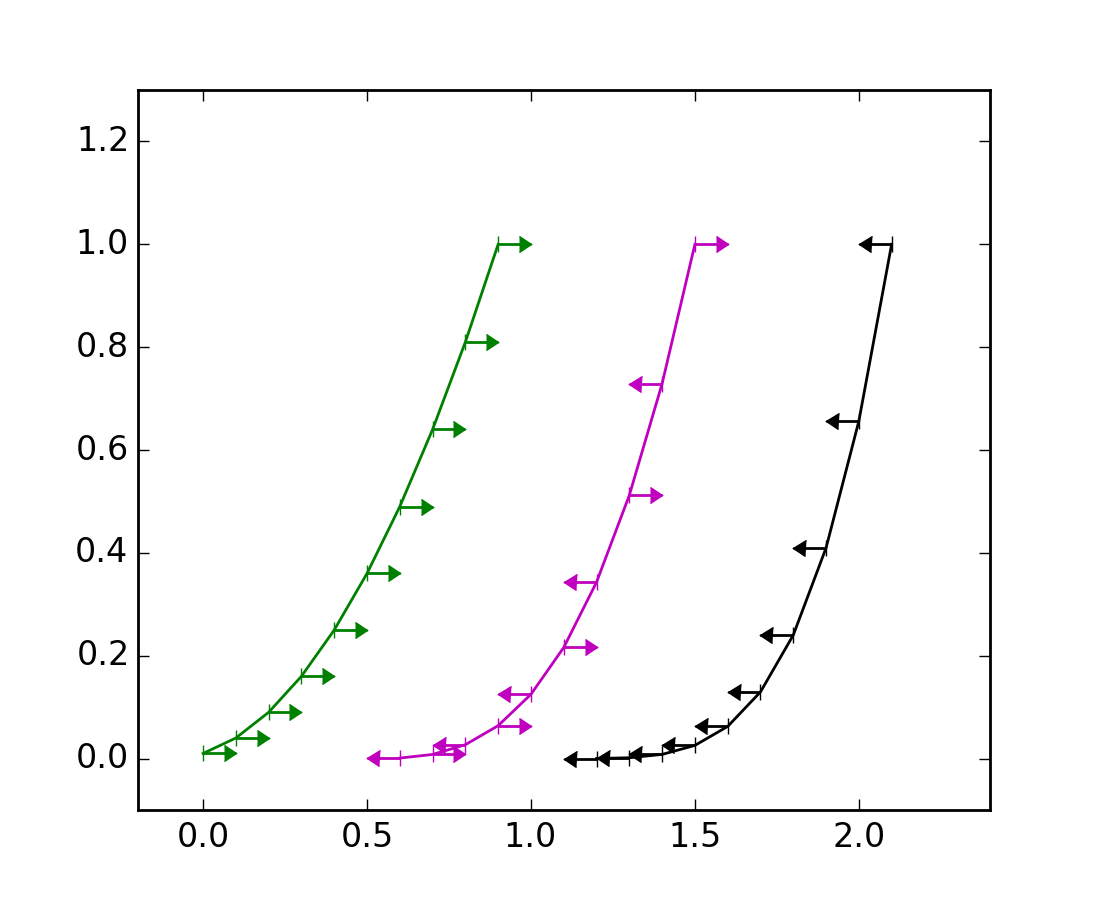
fig = P.figure()
x = arange(10.0)/10.0
y = (x+0.1)**2
P.errorbar(x, y, xerr=0.1, xlolims=True)
y = (x+0.1)**3
P.errorbar(x+0.6, y, xerr=0.1, xuplims=upperlimits, xlolims=lowerlimits)
y = (x+0.1)**4
P.errorbar(x+1.2, y, xerr=0.1, xuplims=True)
P.xlim(-0.2,2.4)
P.ylim(-0.1,1.3)
P.show()
Keywords: python, matplotlib, pylab, example, codex (see Search examples)

