
(Source code, png, hires.png, pdf)

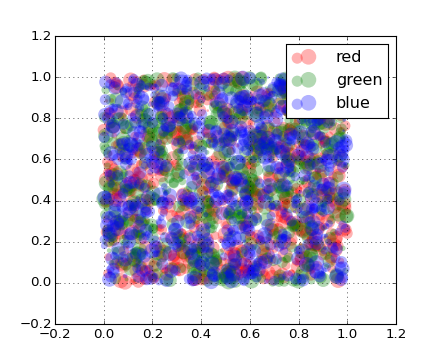
import matplotlib.pyplot as plt
from numpy.random import rand


for color in ['red', 'green', 'blue']:
    n = 750
    x, y = rand(2, n)
    scale = 200.0 * rand(n)
    plt.scatter(x, y, c=color, s=scale, label=color,
                alpha=0.3, edgecolors='none')

plt.legend()
plt.grid(True)

plt.show()
Keywords: python, matplotlib, pylab, example, codex (see Search examples)