
Matplotlib has the option to use LaTeX to manage all text layout. This option is available with the following backends:
The LaTeX option is activated by setting text.usetex : True in your rc settings. Text handling with matplotlib’s LaTeX support is slower than matplotlib’s very capable mathtext, but is more flexible, since different LaTeX packages (font packages, math packages, etc.) can be used. The results can be striking, especially when you take care to use the same fonts in your figures as in the main document.
Matplotlib’s LaTeX support requires a working LaTeX installation, dvipng (which may be included with your LaTeX installation), and Ghostscript (GPL Ghostscript 8.60 or later is recommended). The executables for these external dependencies must all be located on your PATH.
There are a couple of options to mention, which can be changed using rc settings. Here is an example matplotlibrc file:
font.family        : serif
font.serif         : Times, Palatino, New Century Schoolbook, Bookman, Computer Modern Roman
font.sans-serif    : Helvetica, Avant Garde, Computer Modern Sans serif
font.cursive       : Zapf Chancery
font.monospace     : Courier, Computer Modern Typewriter

text.usetex        : true
The first valid font in each family is the one that will be loaded. If the fonts are not specified, the Computer Modern fonts are used by default. All of the other fonts are Adobe fonts. Times and Palatino each have their own accompanying math fonts, while the other Adobe serif fonts make use of the Computer Modern math fonts. See the PSNFSS documentation for more details.
To use LaTeX and select Helvetica as the default font, without editing matplotlibrc use:
from matplotlib import rc
rc('font',**{'family':'sans-serif','sans-serif':['Helvetica']})
## for Palatino and other serif fonts use:
#rc('font',**{'family':'serif','serif':['Palatino']})
rc('text', usetex=True)
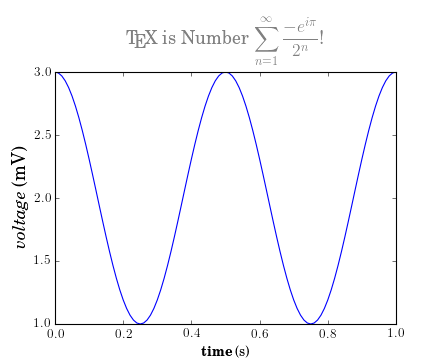
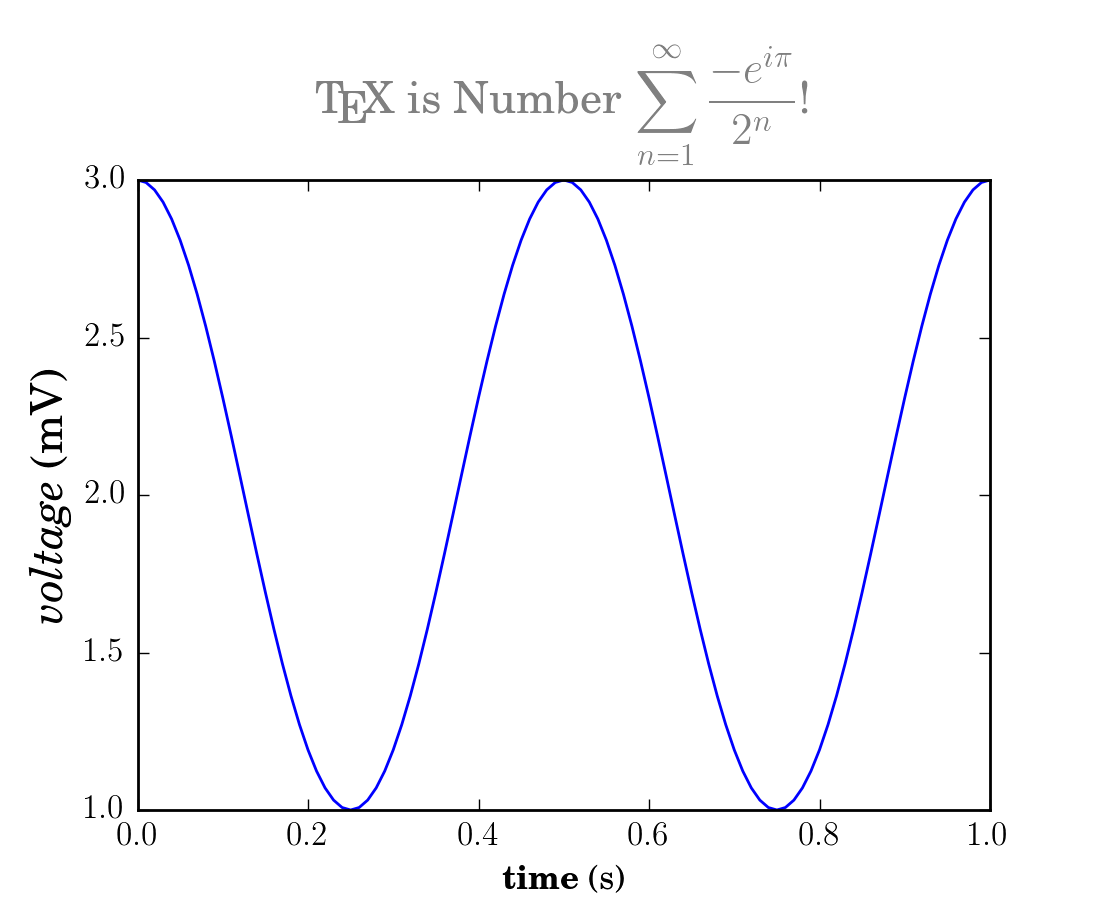
Here is the standard example, tex_demo.py:
"""
Demo of TeX rendering.

You can use TeX to render all of your matplotlib text if the rc
parameter text.usetex is set.  This works currently on the agg and ps
backends, and requires that you have tex and the other dependencies
described at http://matplotlib.sf.net/matplotlib.texmanager.html
properly installed on your system.  The first time you run a script
you will see a lot of output from tex and associated tools.  The next
time, the run may be silent, as a lot of the information is cached in
~/.tex.cache

"""
import numpy as np
import matplotlib.pyplot as plt


# Example data
t = np.arange(0.0, 1.0 + 0.01, 0.01)
s = np.cos(4 * np.pi * t) + 2

plt.rc('text', usetex=True)
plt.rc('font', family='serif')
plt.plot(t, s)

plt.xlabel(r'\textbf{time} (s)')
plt.ylabel(r'\textit{voltage} (mV)',fontsize=16)
plt.title(r"\TeX\ is Number "
          r"$\displaystyle\sum_{n=1}^\infty\frac{-e^{i\pi}}{2^n}$!",
          fontsize=16, color='gray')
# Make room for the ridiculously large title.
plt.subplots_adjust(top=0.8)

plt.savefig('tex_demo')
plt.show()
(Source code, png, hires.png, pdf)

Note that display math mode ($$ e=mc^2 $$) is not supported, but adding the command \displaystyle, as in tex_demo.py, will produce the same results.
Note
Certain characters require special escaping in TeX, such as:
# $ % & ~ _ ^ \ { } \( \) \[ \]
Therefore, these characters will behave differently depending on the rcParam text.usetex flag.
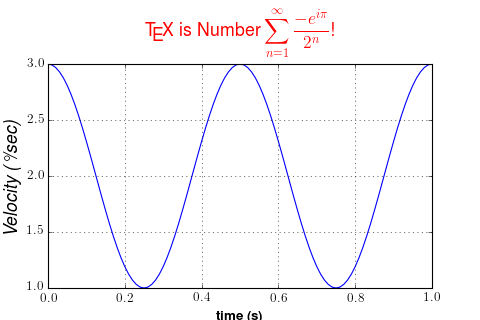
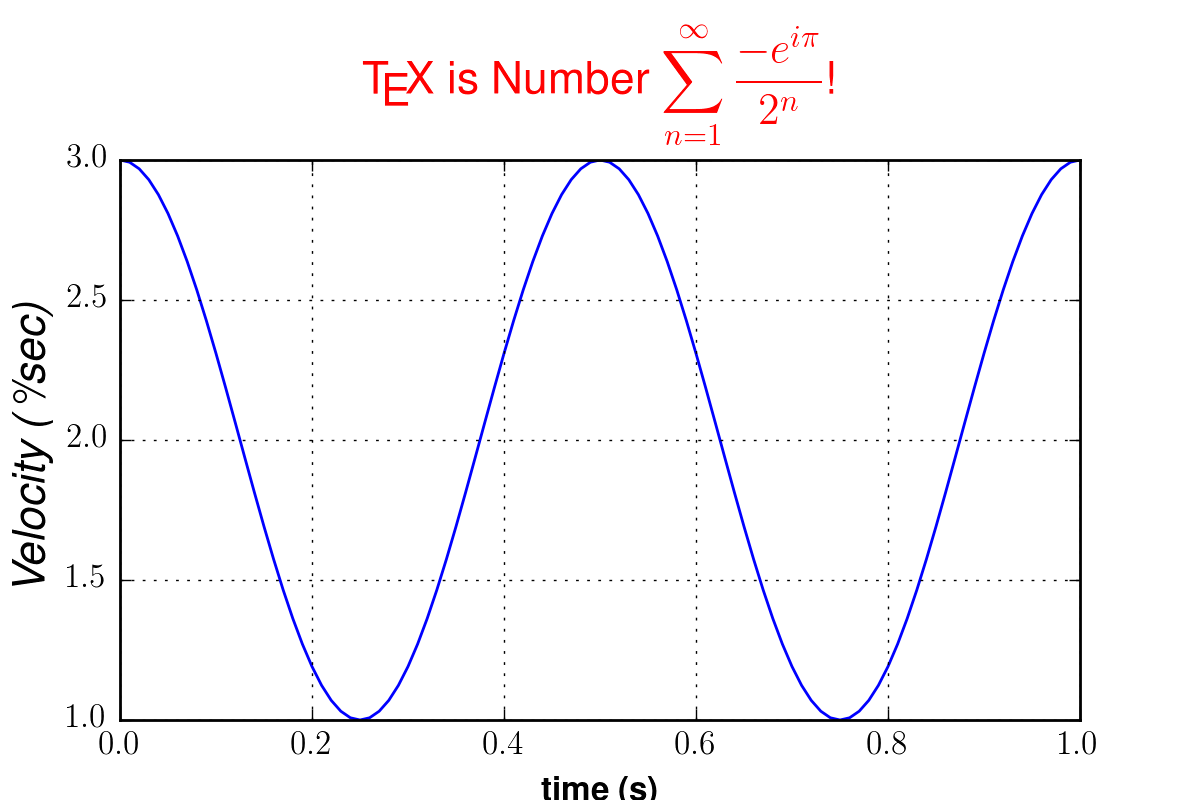
It is also possible to use unicode strings with the LaTeX text manager, here is an example taken from tex_unicode_demo.py:
#!/usr/bin/env python
# -*- coding: utf-8 -*-
"""
This demo is tex_demo.py modified to have unicode. See that file for
more information.
"""
from __future__ import unicode_literals
import matplotlib as mpl
mpl.rcParams['text.usetex']=True
mpl.rcParams['text.latex.unicode']=True
from numpy import arange, cos, pi
from matplotlib.pyplot import (figure, axes, plot, xlabel, ylabel, title,
     grid, savefig, show)

figure(1, figsize=(6,4))
ax = axes([0.1, 0.1, 0.8, 0.7])
t = arange(0.0, 1.0+0.01, 0.01)
s = cos(2*2*pi*t)+2
plot(t, s)

xlabel(r'\textbf{time (s)}')
ylabel(r'\textit{Velocity (\u00B0/sec)}', fontsize=16)
title(r"\TeX\ is Number $\displaystyle\sum_{n=1}^\infty\frac{-e^{i\pi}}{2^n}$!",
      fontsize=16, color='r')
grid(True)
show()
(Source code, png, hires.png, pdf)
In order to produce encapsulated postscript files that can be embedded in a new LaTeX document, the default behavior of matplotlib is to distill the output, which removes some postscript operators used by LaTeX that are illegal in an eps file. This step produces results which may be unacceptable to some users, because the text is coarsely rasterized and converted to bitmaps, which are not scalable like standard postscript, and the text is not searchable. One workaround is to to set ps.distiller.res to a higher value (perhaps 6000) in your rc settings, which will produce larger files but may look better and scale reasonably. A better workaround, which requires Poppler or Xpdf, can be activated by changing the ps.usedistiller rc setting to xpdf. This alternative produces postscript without rasterizing text, so it scales properly, can be edited in Adobe Illustrator, and searched text in pdf documents.