
Matplotlib’s patheffects module provides functionality to apply a multiple draw stage to any Artist which can be rendered via a Path.
Artists which can have a path effect applied to them include Patch, Line2D, Collection and even Text. Each artist’s path effects can be controlled via the set_path_effects method (set_path_effects), which takes an iterable of AbstractPathEffect instances.
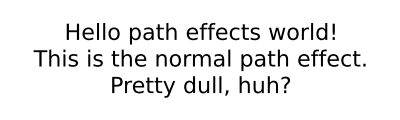
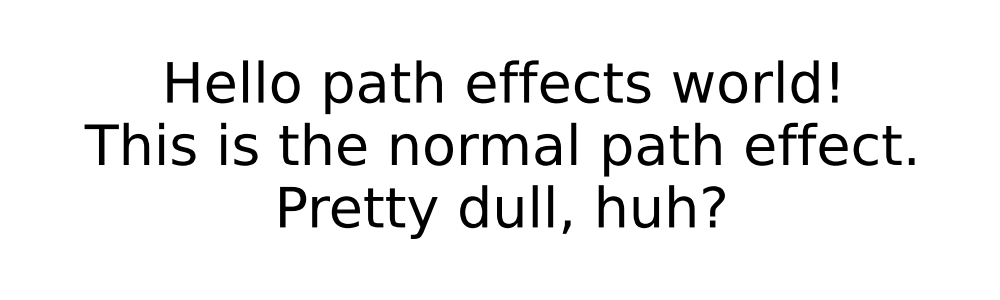
The simplest path effect is the Normal effect, which simply draws the artist without any effect:
import matplotlib.pyplot as plt
import matplotlib.patheffects as path_effects

fig = plt.figure(figsize=(5, 1.5))
text = fig.text(0.5, 0.5, 'Hello path effects world!\nThis is the normal '
                          'path effect.\nPretty dull, huh?',
                ha='center', va='center', size=20)
text.set_path_effects([path_effects.Normal()])
plt.show()
(Source code, png, hires.png, pdf)
Whilst the plot doesn’t look any different to what you would expect without any path effects, the drawing of the text now been changed to use the the path effects framework, opening up the possibilities for more interesting examples.
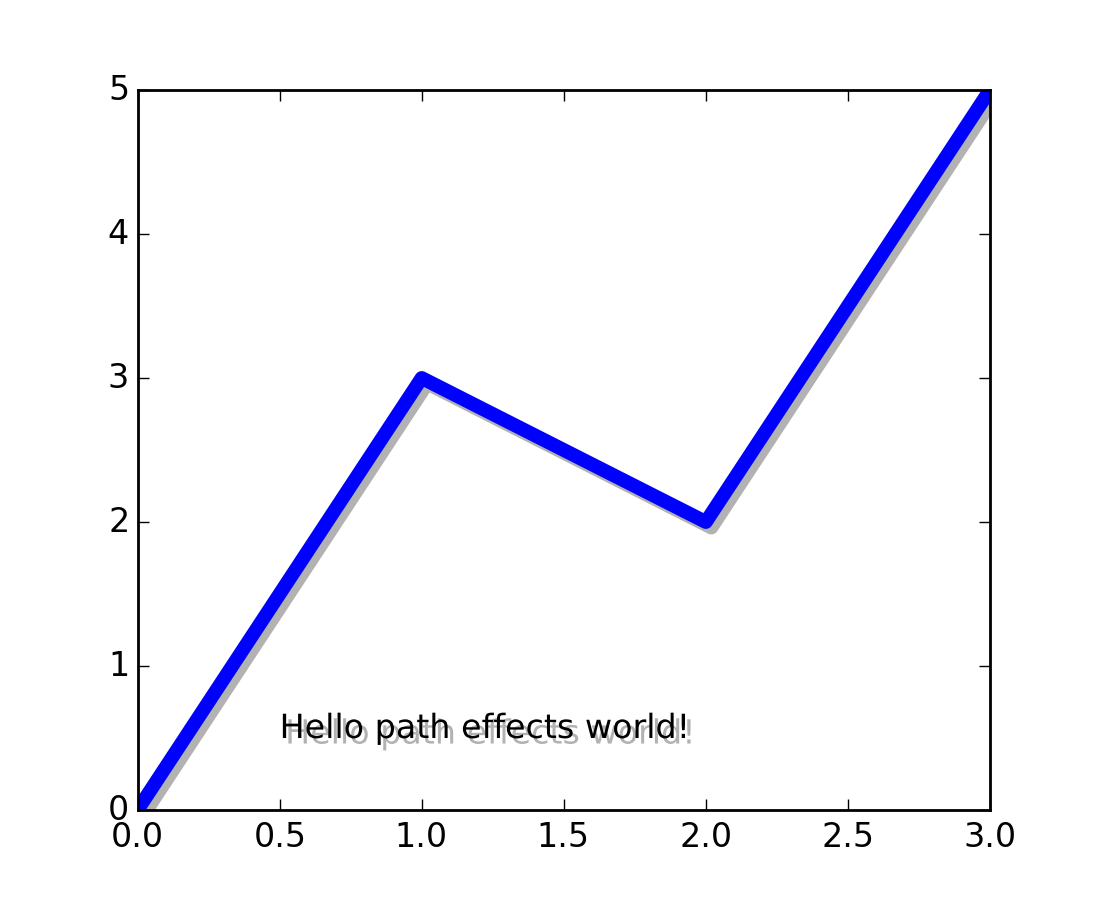
A far more interesting path effect than Normal is the drop-shadow, which we can apply to any of our path based artists. The classes SimplePatchShadow and SimpleLineShadow do precisely this by drawing either a filled patch or a line patch below the original artist:
import matplotlib.pyplot as plt
import matplotlib.patheffects as path_effects

text = plt.text(0.5, 0.5, 'Hello path effects world!',
                path_effects=[path_effects.withSimplePatchShadow()])

plt.plot([0, 3, 2, 5], linewidth=5, color='blue',
         path_effects=[path_effects.SimpleLineShadow(),
                       path_effects.Normal()])
plt.show()
(Source code, png, hires.png, pdf)
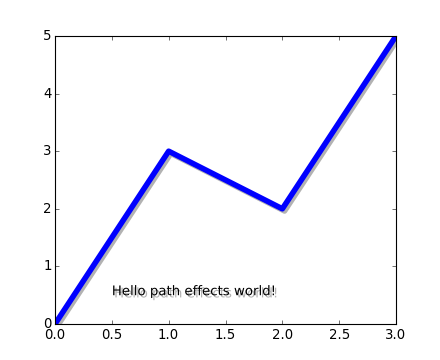
Notice the two approaches to setting the path effects in this example. The first uses the with* classes to include the desired functionality automatically followed with the “normal” effect, whereas the latter explicitly defines the two path effects to draw.
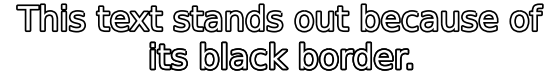
One nice way of making artists visually stand out is to draw an outline in a bold color below the actual artist. The Stroke path effect makes this a relatively simple task:
import matplotlib.pyplot as plt
import matplotlib.patheffects as path_effects

fig = plt.figure(figsize=(7, 1))
text = fig.text(0.5, 0.5, 'This text stands out because of\n'
                          'its black border.', color='white',
                          ha='center', va='center', size=30)
text.set_path_effects([path_effects.Stroke(linewidth=3, foreground='black'),
                       path_effects.Normal()])
plt.show()
(Source code, png, hires.png, pdf)

It is important to note that this effect only works because we have drawn the text path twice; once with a thick black line, and then once with the original text path on top.
You may have noticed that the keywords to Stroke and SimplePatchShadow and SimpleLineShadow are not the usual Artist keywords (such as facecolor and edgecolor etc.). This is because with these path effects we are operating at lower level of matplotlib. In fact, the keywords which are accepted are those for a matplotlib.backend_bases.GraphicsContextBase instance, which have been designed for making it easy to create new backends - and not for its user interface.
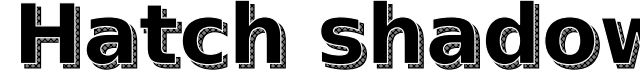
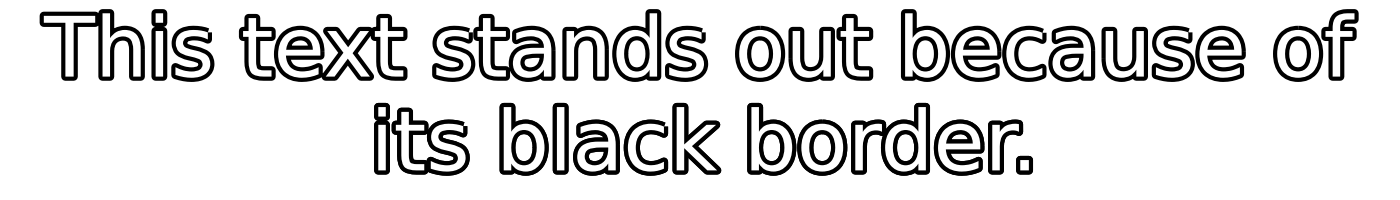
As already mentioned, some of the path effects operate at a lower level than most users will be used to, meaning that setting keywords such as facecolor and edgecolor raise an AttributeError. Luckily there is a generic PathPatchEffect path effect which creates a PathPatch class with the original path. The keywords to this effect are identical to those of PathPatch:
import matplotlib.pyplot as plt
import matplotlib.patheffects as path_effects

fig = plt.figure(figsize=(8, 1))
t = fig.text(0.02, 0.5, 'Hatch shadow', fontsize=75, weight=1000, va='center')
t.set_path_effects([path_effects.PathPatchEffect(offset=(4, -4), hatch='xxxx',
                                                  facecolor='gray'),
                    path_effects.PathPatchEffect(edgecolor='white', linewidth=1.1,
                                                 facecolor='black')])
plt.show()
(Source code, png, hires.png, pdf)