
(Source code, png, hires.png, pdf)

"""
Test unit support with each of the matplotlib primitive artist types
The axes handles unit conversions and the artists keep a pointer to
their axes parent, so you must init the artists with the axes instance
if you want to initialize them with unit data, or else they will not
know how to convert the units to scalars
"""
import random
import matplotlib.lines as lines
import matplotlib.patches as patches
import matplotlib.text as text
import matplotlib.collections as collections
from basic_units import cm, inch
import numpy as np
import matplotlib.pyplot as plt
fig, ax = plt.subplots()
ax.xaxis.set_units(cm)
ax.yaxis.set_units(cm)
if 0:
# test a line collection
# Not supported at present.
verts = []
for i in range(10):
# a random line segment in inches
verts.append(zip(*inch*10*np.random.rand(2, random.randint(2,15))))
lc = collections.LineCollection(verts, axes=ax)
ax.add_collection(lc)
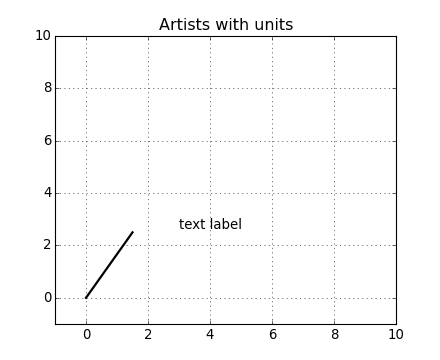
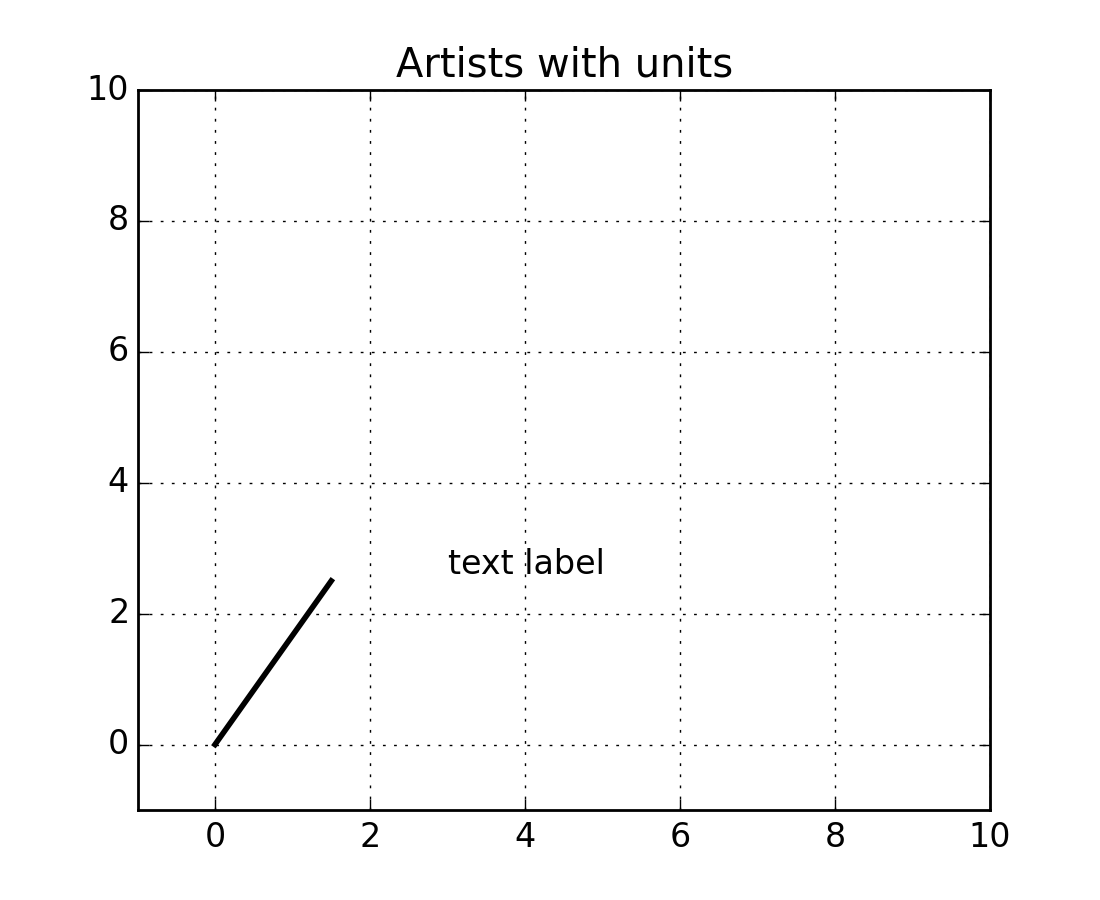
# test a plain-ol-line
line = lines.Line2D([0*cm, 1.5*cm], [0*cm, 2.5*cm], lw=2, color='black', axes=ax)
ax.add_line(line)
if 0:
# test a patch
# Not supported at present.
rect = patches.Rectangle( (1*cm, 1*cm), width=5*cm, height=2*cm, alpha=0.2, axes=ax)
ax.add_patch(rect)
t = text.Text(3*cm, 2.5*cm, 'text label', ha='left', va='bottom', axes=ax)
ax.add_artist(t)
ax.set_xlim(-1*cm, 10*cm)
ax.set_ylim(-1*cm, 10*cm)
#ax.xaxis.set_units(inch)
ax.grid(True)
ax.set_title("Artists with units")
plt.show()
Keywords: python, matplotlib, pylab, example, codex (see Search examples)