
(Source code, png, hires.png, pdf)
"""
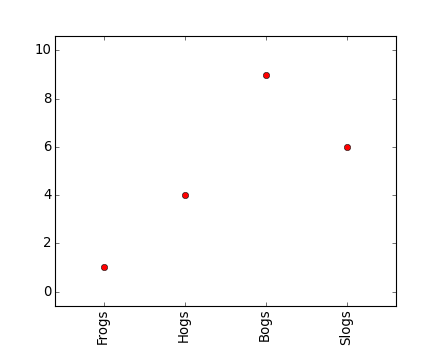
Demo of custom tick-labels with user-defined rotation.
"""
import matplotlib.pyplot as plt
x = [1, 2, 3, 4]
y = [1, 4, 9, 6]
labels = ['Frogs', 'Hogs', 'Bogs', 'Slogs']
plt.plot(x, y, 'ro')
# You can specify a rotation for the tick labels in degrees or with keywords.
plt.xticks(x, labels, rotation='vertical')
# Pad margins so that markers don't get clipped by the axes
plt.margins(0.2)
# Tweak spacing to prevent clipping of tick-labels
plt.subplots_adjust(bottom=0.15)
plt.show()
Keywords: python, matplotlib, pylab, example, codex (see Search examples)