
(Source code, png, hires.png, pdf)
"""
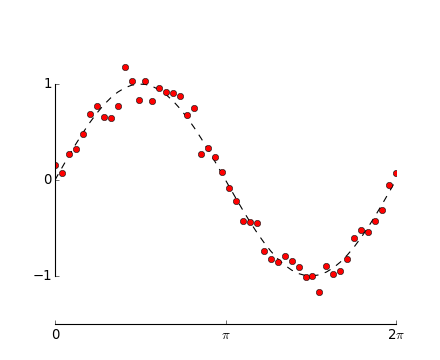
Demo of spines using custom bounds to limit the extent of the spine.
"""
import numpy as np
import matplotlib.pyplot as plt
x = np.linspace(0, 2*np.pi, 50)
y = np.sin(x)
y2 = y + 0.1 * np.random.normal(size=x.shape)
fig, ax = plt.subplots()
ax.plot(x, y, 'k--')
ax.plot(x, y2, 'ro')
# set ticks and tick labels
ax.set_xlim((0, 2*np.pi))
ax.set_xticks([0, np.pi, 2*np.pi])
ax.set_xticklabels(['0', '$\pi$','2$\pi$'])
ax.set_ylim((-1.5, 1.5))
ax.set_yticks([-1, 0, 1])
# Only draw spine between the y-ticks
ax.spines['left'].set_bounds(-1, 1)
# Hide the right and top spines
ax.spines['right'].set_visible(False)
ax.spines['top'].set_visible(False)
# Only show ticks on the left and bottom spines
ax.yaxis.set_ticks_position('left')
ax.xaxis.set_ticks_position('bottom')
plt.show()
Keywords: python, matplotlib, pylab, example, codex (see Search examples)