
(Source code, png, hires.png, pdf)


"""
Demo of the new boxplot drawer function
"""
import numpy as np
import matplotlib.pyplot as plt
import matplotlib.cbook as cbook
# fake data
np.random.seed(937)
data = np.random.lognormal(size=(37, 4), mean=1.5, sigma=1.75)
labels = list('ABCD')
# compute the boxplot stats
stats = cbook.boxplot_stats(data, labels=labels, bootstrap=10000)
# After we've computed the stats, we can go through and change anything.
# Just to prove it, I'll set the median of each set to the median of all
# the data, and double the means
for n in range(len(stats)):
stats[n]['med'] = np.median(data)
stats[n]['mean'] *= 2
print(stats[0].keys())
fs = 10 # fontsize
# demonstrate how to toggle the display of different elements:
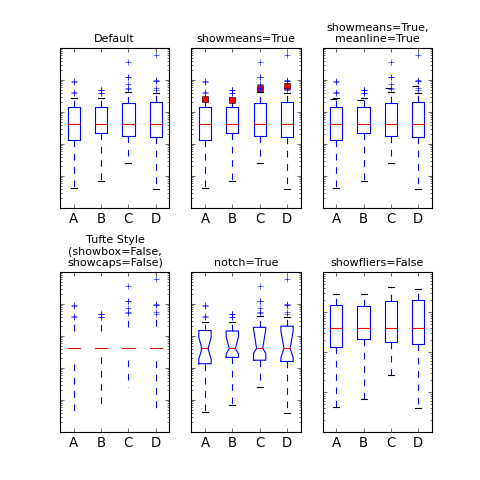
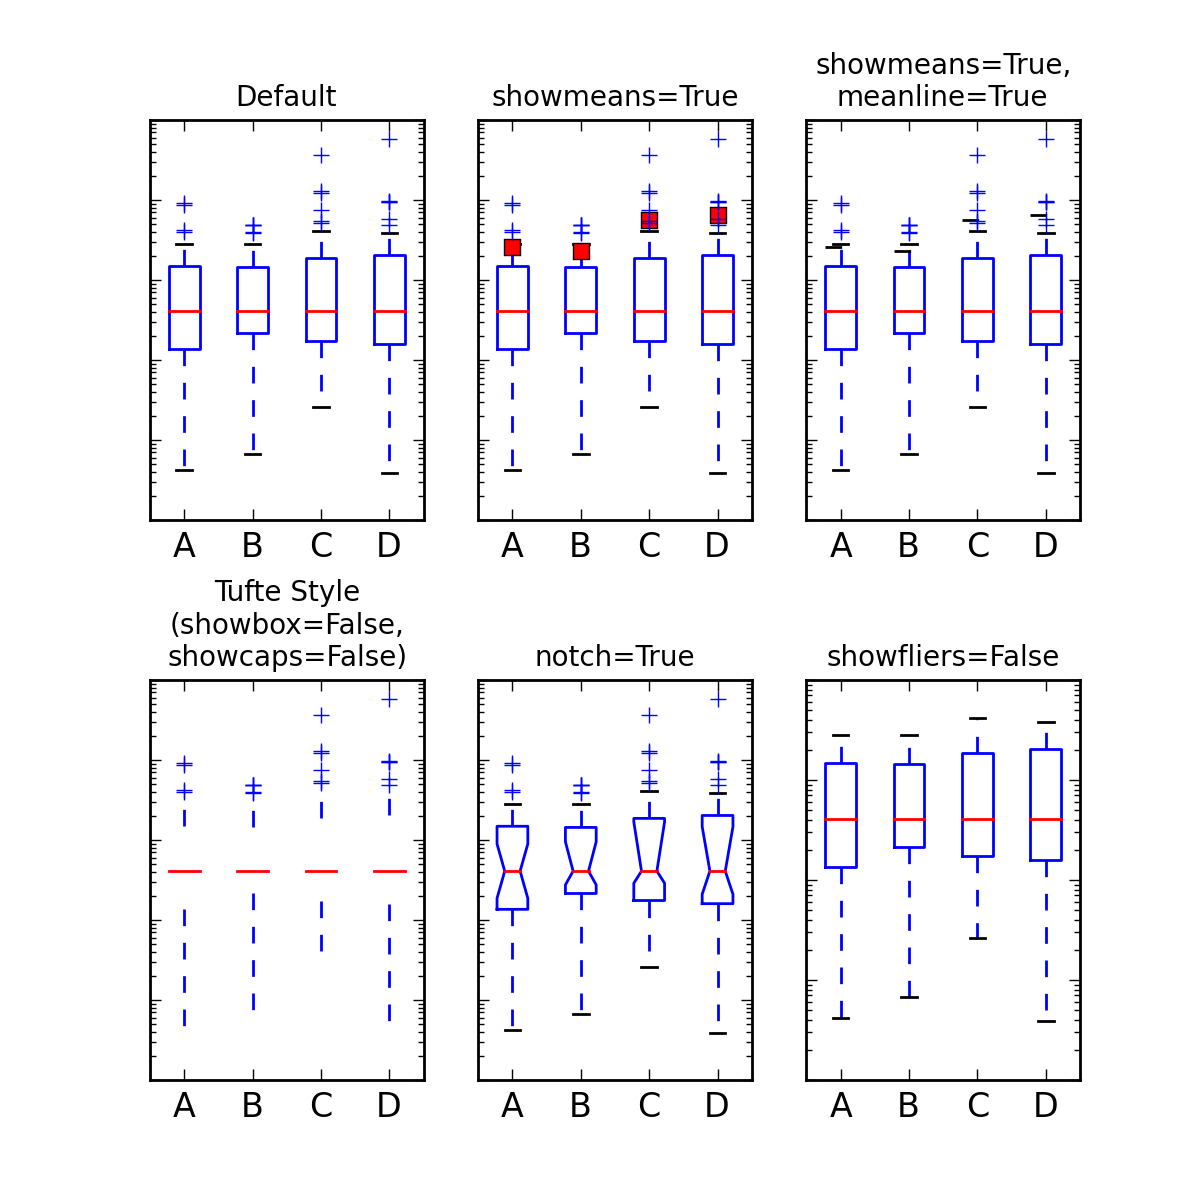
fig, axes = plt.subplots(nrows=2, ncols=3, figsize=(6,6))
axes[0, 0].bxp(stats)
axes[0, 0].set_title('Default', fontsize=fs)
axes[0, 1].bxp(stats, showmeans=True)
axes[0, 1].set_title('showmeans=True', fontsize=fs)
axes[0, 2].bxp(stats, showmeans=True, meanline=True)
axes[0, 2].set_title('showmeans=True,\nmeanline=True', fontsize=fs)
axes[1, 0].bxp(stats, showbox=False, showcaps=False)
axes[1, 0].set_title('Tufte Style\n(showbox=False,\nshowcaps=False)', fontsize=fs)
axes[1, 1].bxp(stats, shownotches=True)
axes[1, 1].set_title('notch=True', fontsize=fs)
axes[1, 2].bxp(stats, showfliers=False)
axes[1, 2].set_title('showfliers=False', fontsize=fs)
for ax in axes.flatten():
ax.set_yscale('log')
ax.set_yticklabels([])
fig.subplots_adjust(hspace=0.4)
plt.show()
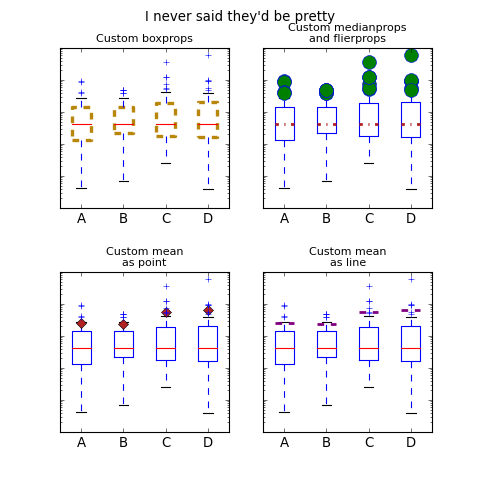
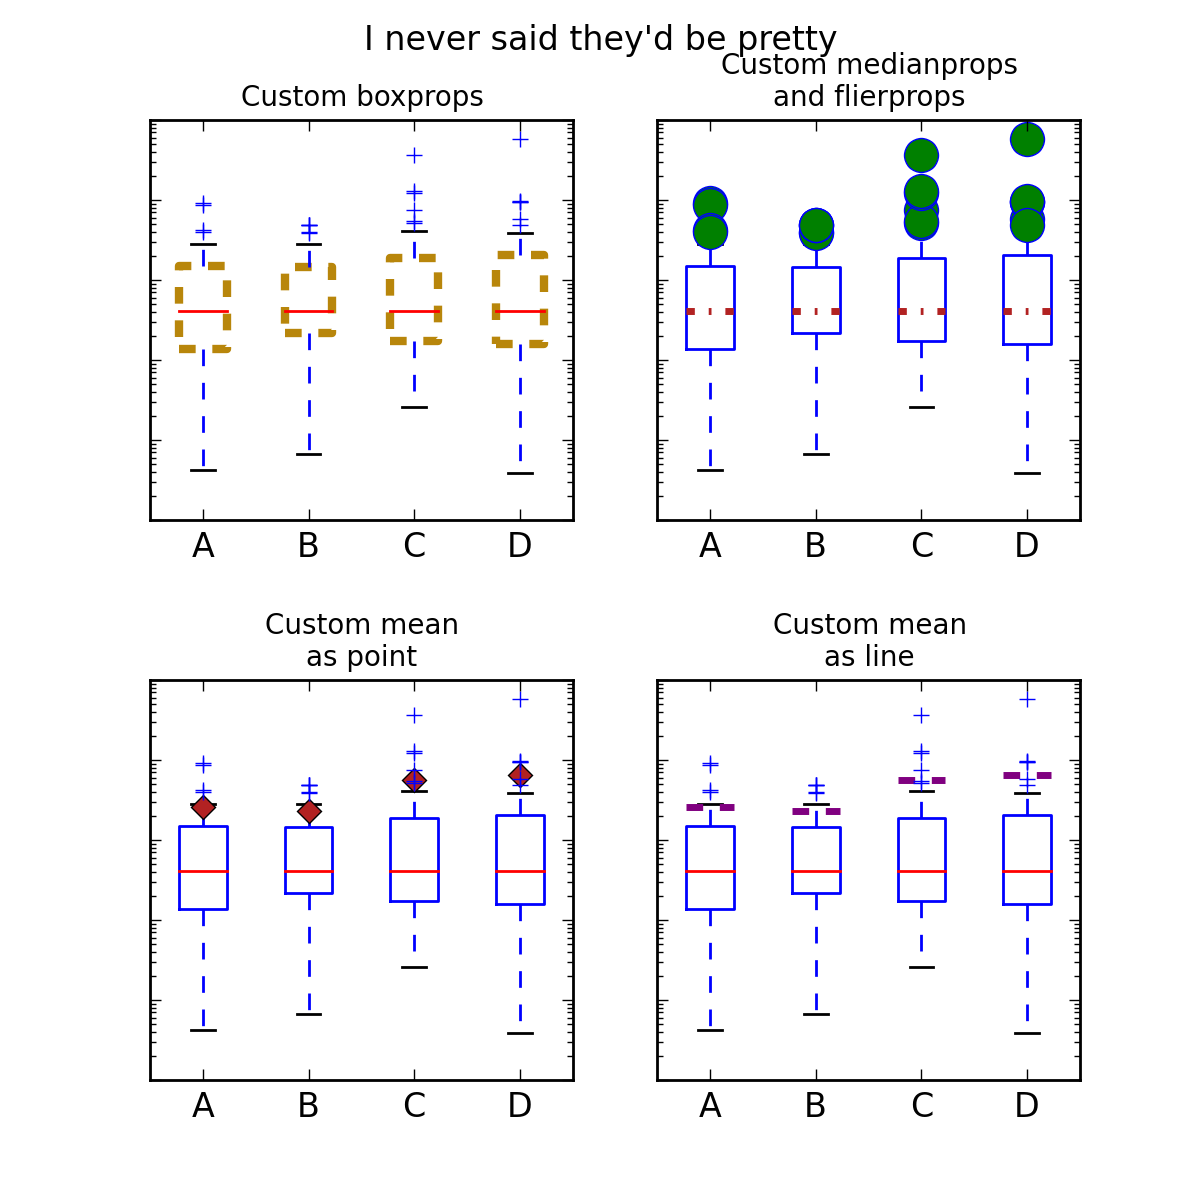
# demonstrate how to customize the display different elements:
boxprops = dict(linestyle='--', linewidth=3, color='darkgoldenrod')
flierprops = dict(marker='o', markerfacecolor='green', markersize=12,
linestyle='none')
medianprops = dict(linestyle='-.', linewidth=2.5, color='firebrick')
meanpointprops = dict(marker='D', markeredgecolor='black',
markerfacecolor='firebrick')
meanlineprops = dict(linestyle='--', linewidth=2.5, color='purple')
fig, axes = plt.subplots(nrows=2, ncols=2, figsize=(6,6))
axes[0, 0].bxp(stats, boxprops=boxprops)
axes[0, 0].set_title('Custom boxprops', fontsize=fs)
axes[0, 1].bxp(stats, flierprops=flierprops, medianprops=medianprops)
axes[0, 1].set_title('Custom medianprops\nand flierprops', fontsize=fs)
axes[1, 0].bxp(stats, meanprops=meanpointprops, meanline=False,
showmeans=True)
axes[1, 0].set_title('Custom mean\nas point', fontsize=fs)
axes[1, 1].bxp(stats, meanprops=meanlineprops, meanline=True, showmeans=True)
axes[1, 1].set_title('Custom mean\nas line', fontsize=fs)
for ax in axes.flatten():
ax.set_yscale('log')
ax.set_yticklabels([])
fig.suptitle("I never said they'd be pretty")
fig.subplots_adjust(hspace=0.4)
plt.show()
Keywords: python, matplotlib, pylab, example, codex (see Search examples)