
(Source code, png, hires.png, pdf)
#!/usr/bin/env python
# -*- coding: utf-8 -*-
"""
This demo is tex_demo.py modified to have unicode. See that file for
more information.
"""
from __future__ import unicode_literals
import matplotlib as mpl
mpl.rcParams['text.usetex']=True
mpl.rcParams['text.latex.unicode']=True
from numpy import arange, cos, pi
from matplotlib.pyplot import (figure, axes, plot, xlabel, ylabel, title,
grid, savefig, show)
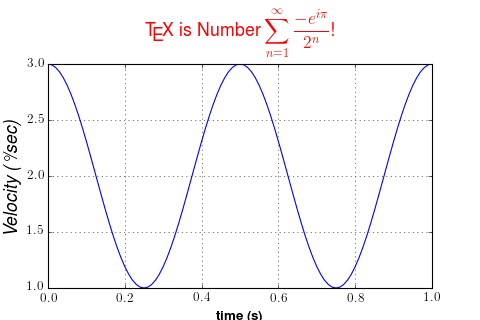
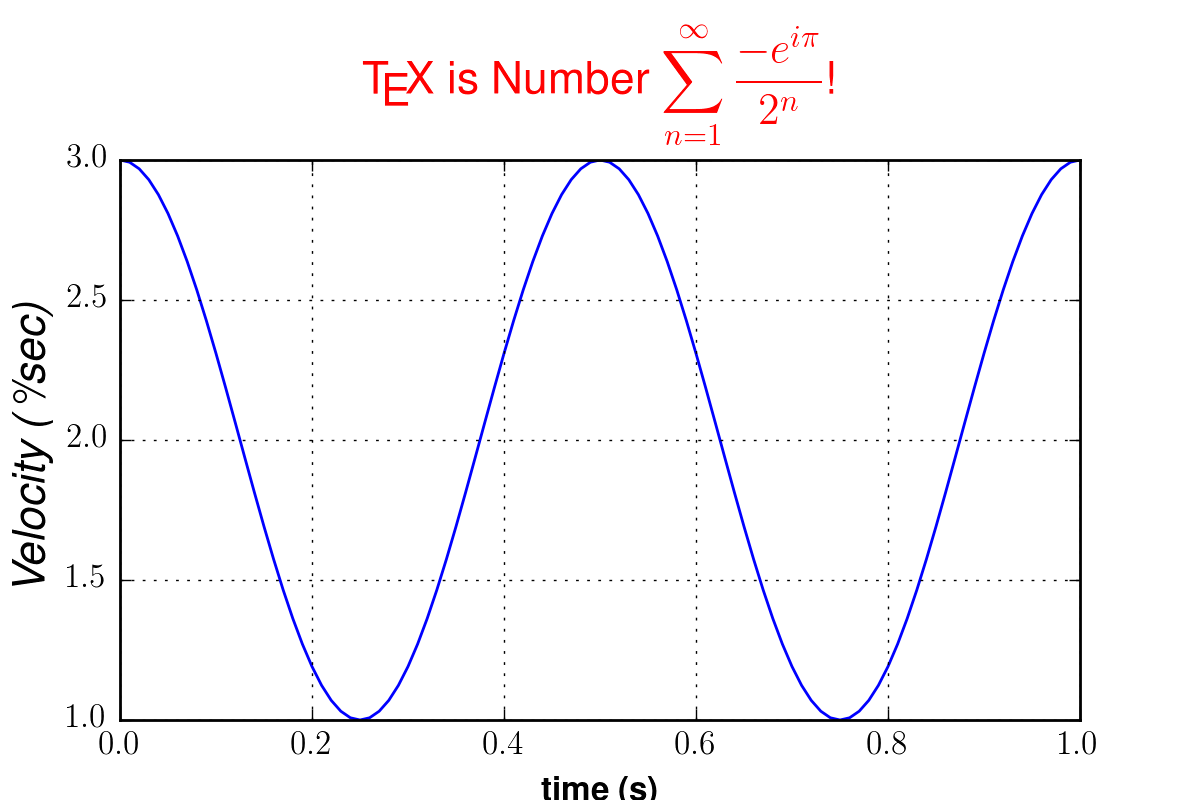
figure(1, figsize=(6,4))
ax = axes([0.1, 0.1, 0.8, 0.7])
t = arange(0.0, 1.0+0.01, 0.01)
s = cos(2*2*pi*t)+2
plot(t, s)
xlabel(r'\textbf{time (s)}')
ylabel(r'\textit{Velocity (\u00B0/sec)}', fontsize=16)
title(r"\TeX\ is Number $\displaystyle\sum_{n=1}^\infty\frac{-e^{i\pi}}{2^n}$!",
fontsize=16, color='r')
grid(True)
show()
Keywords: python, matplotlib, pylab, example, codex (see Search examples)