
(Source code, png, hires.png, pdf)

#!/usr/bin/env python
"""
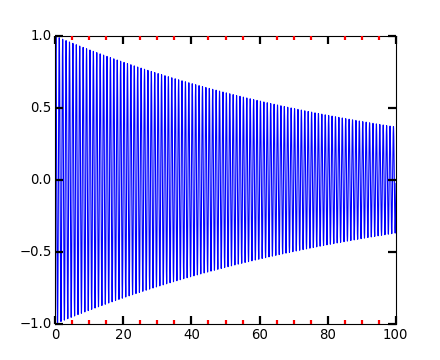
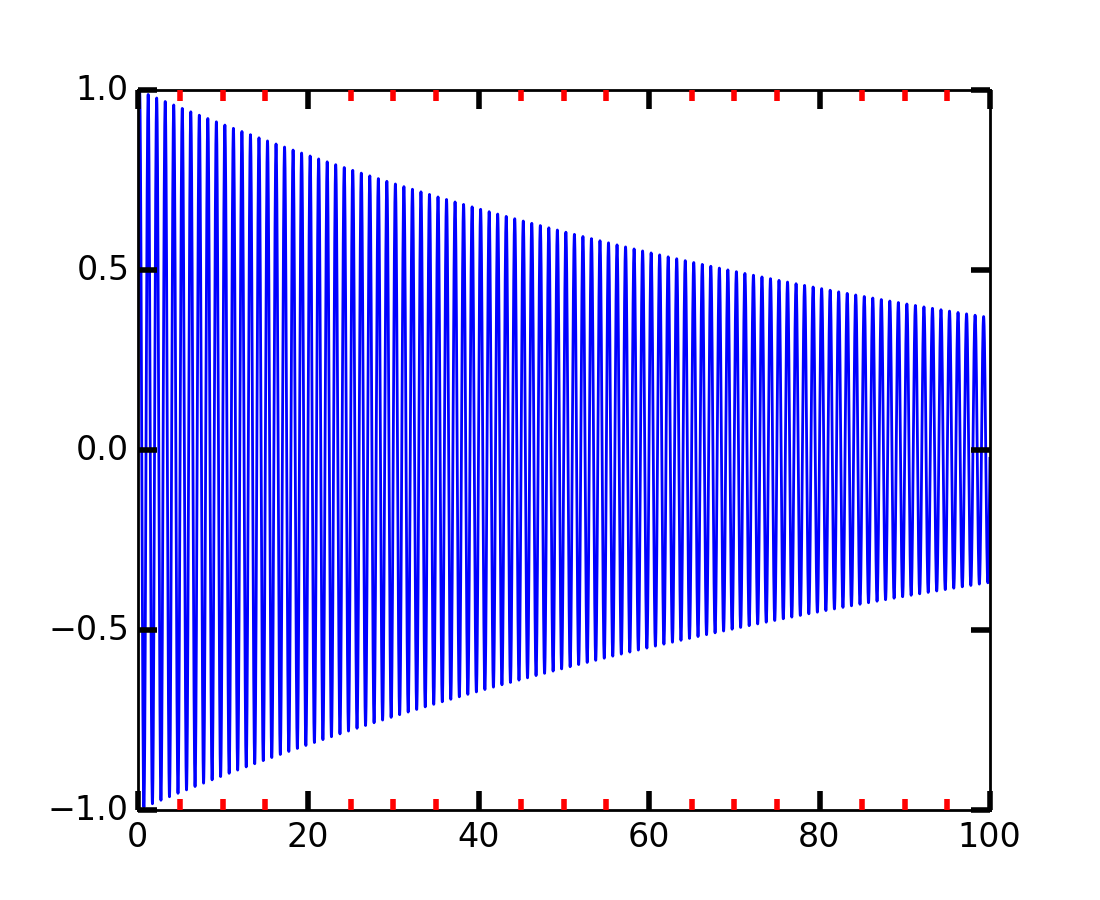
Automatic tick selection for major and minor ticks.
Use interactive pan and zoom to see how the tick intervals
change. There will be either 4 or 5 minor tick intervals
per major interval, depending on the major interval.
"""
import numpy as np
import matplotlib.pyplot as plt
from matplotlib.ticker import AutoMinorLocator
# One can supply an argument to AutoMinorLocator to
# specify a fixed number of minor intervals per major interval, e.g.:
# minorLocator = AutoMinorLocator(2)
# would lead to a single minor tick between major ticks.
minorLocator = AutoMinorLocator()
t = np.arange(0.0, 100.0, 0.01)
s = np.sin(2*np.pi*t)*np.exp(-t*0.01)
fig, ax = plt.subplots()
plt.plot(t,s)
ax.xaxis.set_minor_locator(minorLocator)
plt.tick_params(which='both', width=2)
plt.tick_params(which='major', length=7)
plt.tick_params(which='minor', length=4, color='r')
plt.show()
Keywords: python, matplotlib, pylab, example, codex (see Search examples)