
(Source code, png, hires.png, pdf)
#clf()
from mpl_toolkits.axes_grid1.axes_grid import ImageGrid
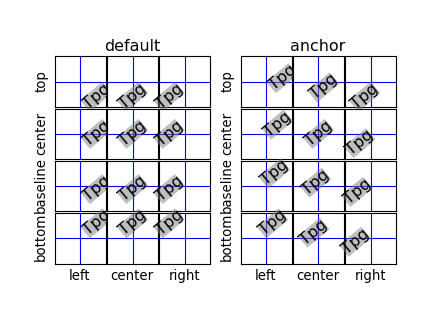
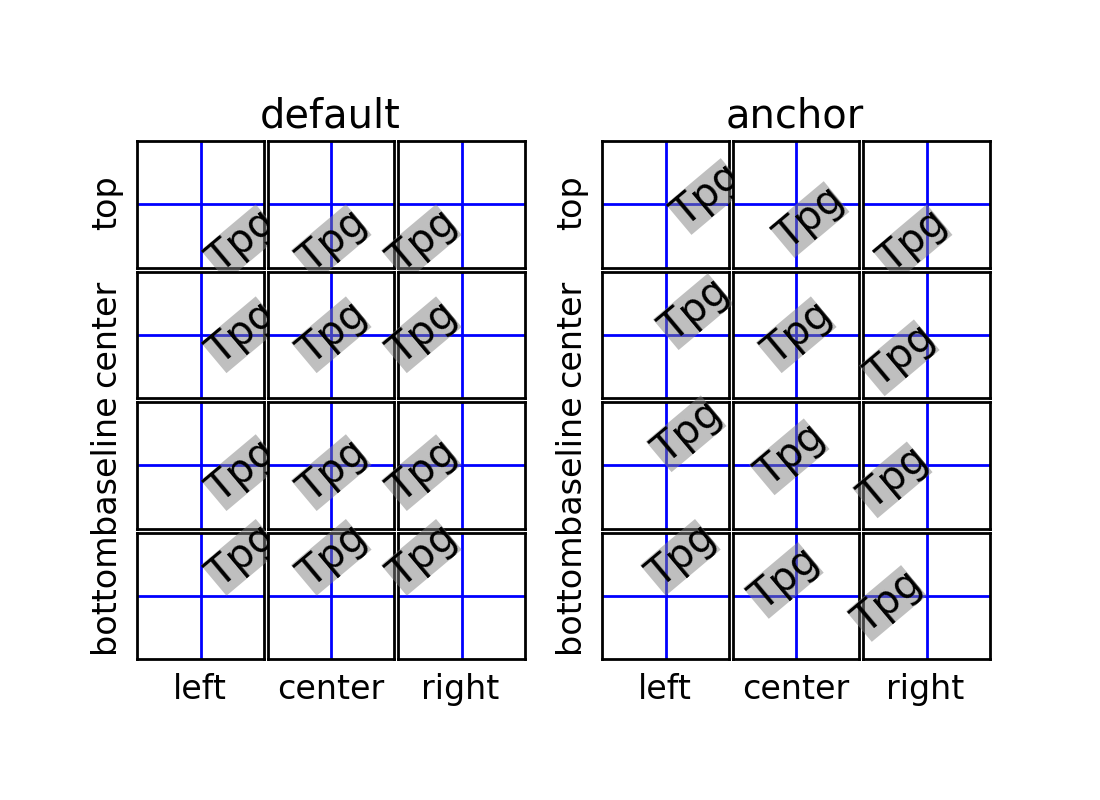
def test_rotation_mode(fig, mode, subplot_location):
ha_list = "left center right".split()
va_list = "top center baseline bottom".split()
grid = ImageGrid(fig, subplot_location,
nrows_ncols=(len(va_list), len(ha_list)),
share_all=True, aspect=True, #label_mode='1',
cbar_mode=None)
for ha, ax in zip(ha_list, grid.axes_row[-1]):
ax.axis["bottom"].label.set_text(ha)
grid.axes_row[0][1].set_title(mode, size="large")
for va, ax in zip(va_list, grid.axes_column[0]):
ax.axis["left"].label.set_text(va)
i = 0
for va in va_list:
for ha in ha_list:
ax = grid[i]
for axis in ax.axis.values():
axis.toggle(ticks=False, ticklabels=False)
ax.text(0.5, 0.5, "Tpg",
size="large", rotation=40,
bbox=dict(boxstyle="square,pad=0.",
ec="none", fc="0.5", alpha=0.5),
ha=ha, va=va,
rotation_mode=mode)
ax.axvline(0.5)
ax.axhline(0.5)
i += 1
if 1:
import matplotlib.pyplot as plt
fig = plt.figure(1, figsize=(5.5,4 ))
fig.clf()
test_rotation_mode(fig, "default", 121)
test_rotation_mode(fig, "anchor", 122)
plt.show()
Keywords: python, matplotlib, pylab, example, codex (see Search examples)