
(Source code, png, hires.png, pdf)
#!/usr/bin/env python
import datetime
import matplotlib.pyplot as plt
from matplotlib.dates import DayLocator, HourLocator, DateFormatter, drange
from numpy import arange
date1 = datetime.datetime( 2000, 3, 2)
date2 = datetime.datetime( 2000, 3, 6)
delta = datetime.timedelta(hours=6)
dates = drange(date1, date2, delta)
y = arange( len(dates)*1.0)
fig, ax = plt.subplots()
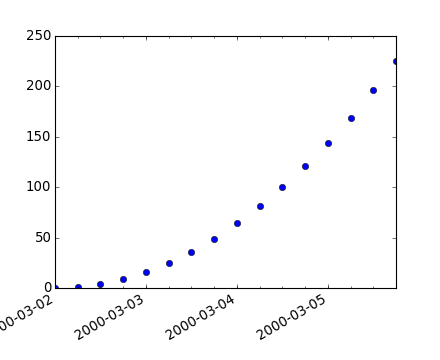
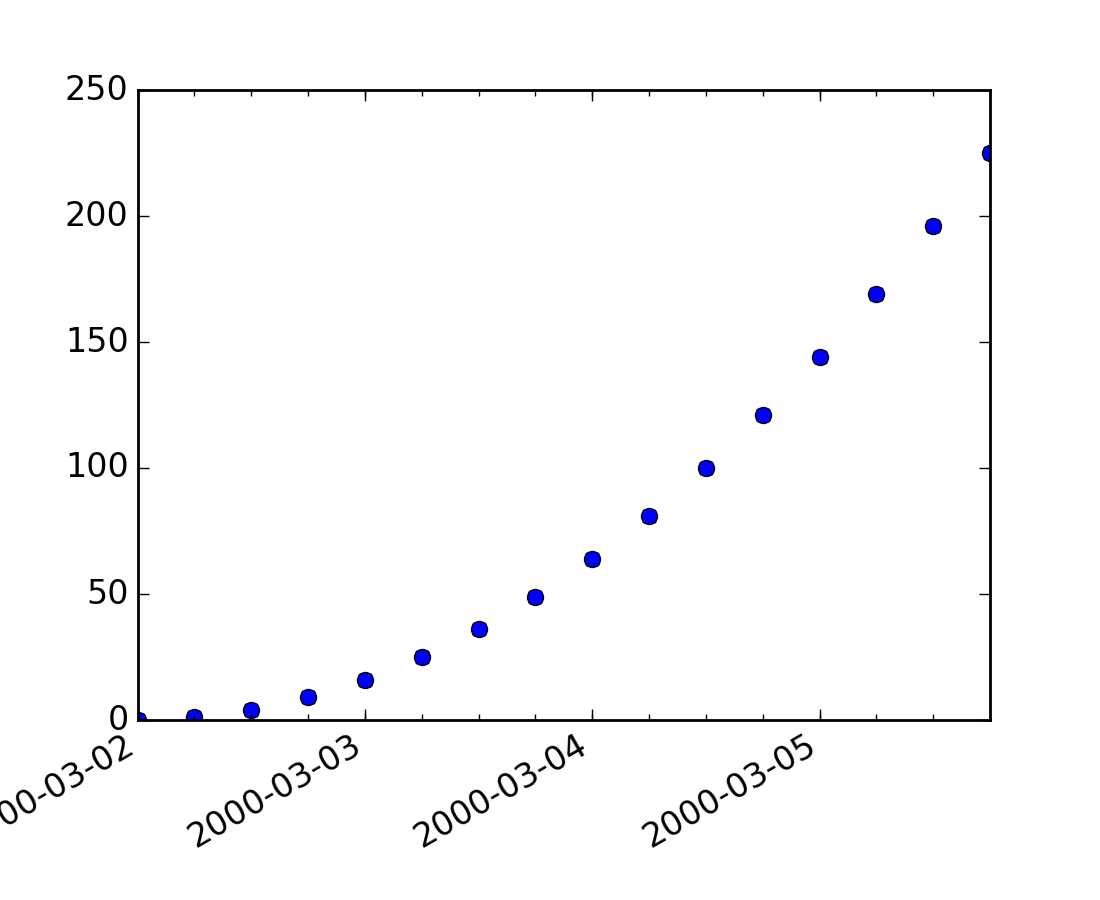
ax.plot_date(dates, y*y)
# this is superfluous, since the autoscaler should get it right, but
# use date2num and num2date to convert between dates and floats if
# you want; both date2num and num2date convert an instance or sequence
ax.set_xlim( dates[0], dates[-1] )
# The hour locator takes the hour or sequence of hours you want to
# tick, not the base multiple
ax.xaxis.set_major_locator( DayLocator() )
ax.xaxis.set_minor_locator( HourLocator(arange(0,25,6)) )
ax.xaxis.set_major_formatter( DateFormatter('%Y-%m-%d') )
ax.fmt_xdata = DateFormatter('%Y-%m-%d %H:%M:%S')
fig.autofmt_xdate()
plt.show()
Keywords: python, matplotlib, pylab, example, codex (see Search examples)