
(Source code, png, hires.png, pdf)
#!/usr/bin/env python
"""
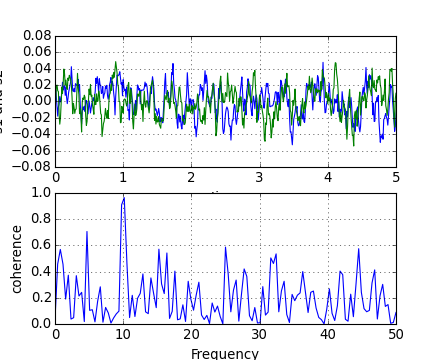
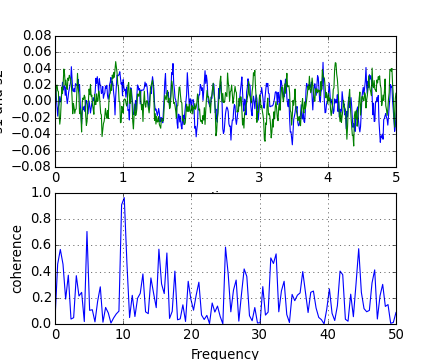
Compute the coherence of two signals
"""
import numpy as np
import matplotlib.pyplot as plt
# make a little extra space between the subplots
plt.subplots_adjust(wspace=0.5)
dt = 0.01
t = np.arange(0, 30, dt)
nse1 = np.random.randn(len(t)) # white noise 1
nse2 = np.random.randn(len(t)) # white noise 2
r = np.exp(-t/0.05)
cnse1 = np.convolve(nse1, r, mode='same')*dt # colored noise 1
cnse2 = np.convolve(nse2, r, mode='same')*dt # colored noise 2
# two signals with a coherent part and a random part
s1 = 0.01*np.sin(2*np.pi*10*t) + cnse1
s2 = 0.01*np.sin(2*np.pi*10*t) + cnse2
plt.subplot(211)
plt.plot(t, s1, 'b-', t, s2, 'g-')
plt.xlim(0,5)
plt.xlabel('time')
plt.ylabel('s1 and s2')
plt.grid(True)
plt.subplot(212)
cxy, f = plt.cohere(s1, s2, 256, 1./dt)
plt.ylabel('coherence')
plt.show()
Keywords: python, matplotlib, pylab, example, codex (see Search examples)