
(Source code, png, hires.png, pdf)
# sometimes it is nice to have ticklabels centered. mpl currently
# associates a label with a tick, and the label can be aligned
# 'center', 'left', or 'right' using the horizontal alignment property:
#
#
# for label in ax.xaxis.get_xticklabels():
# label.set_horizontalalignment('right')
#
#
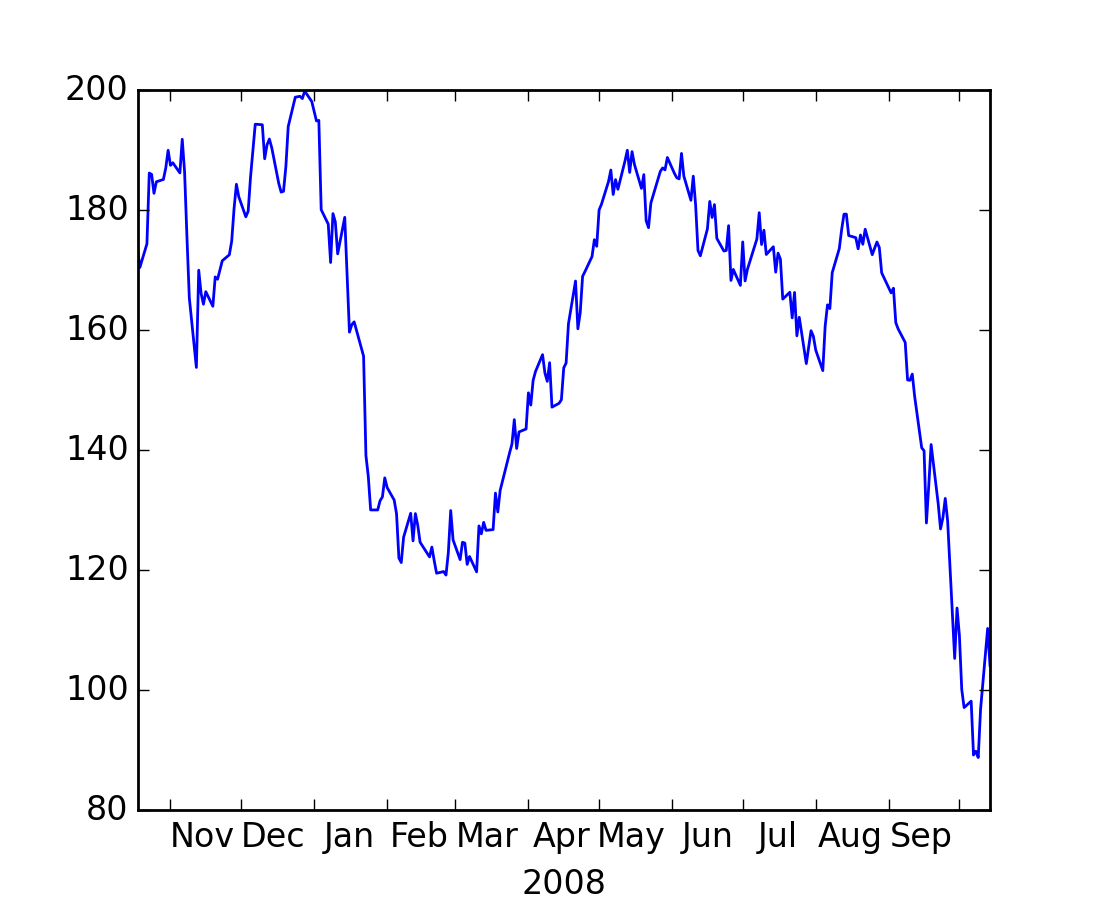
# but this doesn't help center the label between ticks. One solution
# is to "face it". Use the minor ticks to place a tick centered
# between the major ticks. Here is an example that labels the months,
# centered between the ticks
import numpy as np
import matplotlib.cbook as cbook
import matplotlib.dates as dates
import matplotlib.ticker as ticker
import matplotlib.pyplot as plt
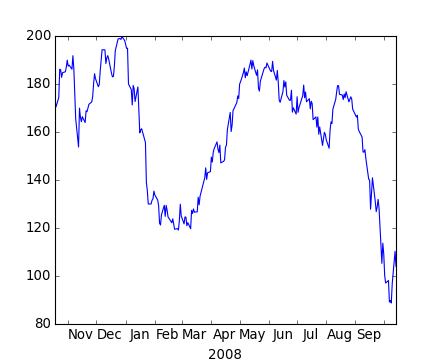
# load some financial data; apple's stock price
fh = cbook.get_sample_data('aapl.npy.gz')
r = np.load(fh); fh.close()
r = r[-250:] # get the last 250 days
fig, ax = plt.subplots()
ax.plot(r.date, r.adj_close)
ax.xaxis.set_major_locator(dates.MonthLocator())
ax.xaxis.set_minor_locator(dates.MonthLocator(bymonthday=15))
ax.xaxis.set_major_formatter(ticker.NullFormatter())
ax.xaxis.set_minor_formatter(dates.DateFormatter('%b'))
for tick in ax.xaxis.get_minor_ticks():
tick.tick1line.set_markersize(0)
tick.tick2line.set_markersize(0)
tick.label1.set_horizontalalignment('center')
imid = len(r)/2
ax.set_xlabel(str(r.date[imid].year))
plt.show()
Keywords: python, matplotlib, pylab, example, codex (see Search examples)