
import numpy as np
import matplotlib.pyplot as plt
from mpl_toolkits.axes_grid1.axes_rgb import make_rgb_axes, RGBAxes
def get_demo_image():
from matplotlib.cbook import get_sample_data
f = get_sample_data("axes_grid/bivariate_normal.npy", asfileobj=False)
z = np.load(f)
# z is a numpy array of 15x15
return z, (-3,4,-4,3)
def get_rgb():
Z, extent = get_demo_image()
Z[Z<0] = 0.
Z = Z/Z.max()
R = Z[:13,:13]
G = Z[2:,2:]
B = Z[:13,2:]
return R, G, B
def make_cube(r, g, b):
ny, nx = r.shape
R = np.zeros([ny, nx, 3], dtype="d")
R[:,:,0] = r
G = np.zeros_like(R)
G[:,:,1] = g
B = np.zeros_like(R)
B[:,:,2] = b
RGB = R + G + B
return R, G, B, RGB
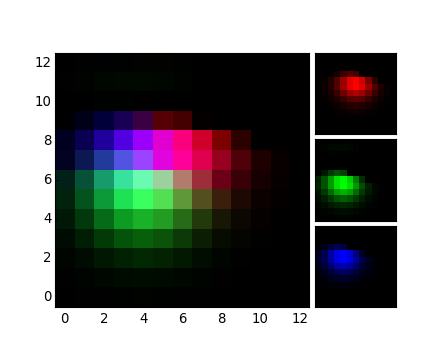
def demo_rgb():
fig, ax = plt.subplots()
ax_r, ax_g, ax_b = make_rgb_axes(ax, pad=0.02)
#fig.add_axes(ax_r)
#fig.add_axes(ax_g)
#fig.add_axes(ax_b)
r, g, b = get_rgb()
im_r, im_g, im_b, im_rgb = make_cube(r, g, b)
kwargs = dict(origin="lower", interpolation="nearest")
ax.imshow(im_rgb, **kwargs)
ax_r.imshow(im_r, **kwargs)
ax_g.imshow(im_g, **kwargs)
ax_b.imshow(im_b, **kwargs)
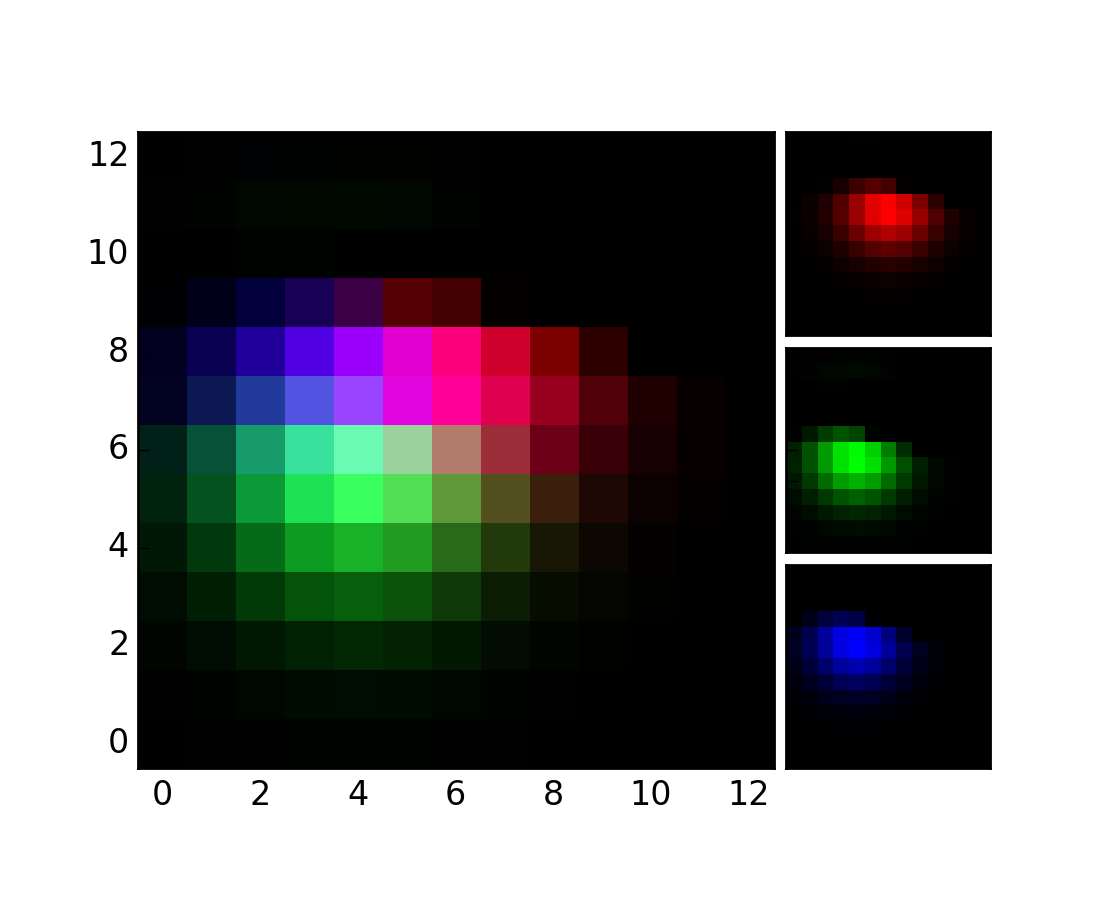
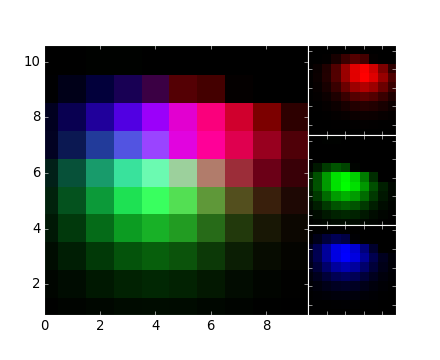
def demo_rgb2():
fig = plt.figure(2)
ax = RGBAxes(fig, [0.1, 0.1, 0.8, 0.8], pad=0.0)
#fig.add_axes(ax)
#ax.add_RGB_to_figure()
r, g, b = get_rgb()
kwargs = dict(origin="lower", interpolation="nearest")
ax.imshow_rgb(r, g, b, **kwargs)
ax.RGB.set_xlim(0., 9.5)
ax.RGB.set_ylim(0.9, 10.6)
for ax1 in [ax.RGB, ax.R, ax.G, ax.B]:
for sp1 in ax1.spines.values():
sp1.set_color("w")
for tick in ax1.xaxis.get_major_ticks() + ax1.yaxis.get_major_ticks():
tick.tick1line.set_mec("w")
tick.tick2line.set_mec("w")
return ax
demo_rgb()
ax = demo_rgb2()
plt.show()
Keywords: python, matplotlib, pylab, example, codex (see Search examples)
