
(Source code, png, hires.png, pdf)
"""
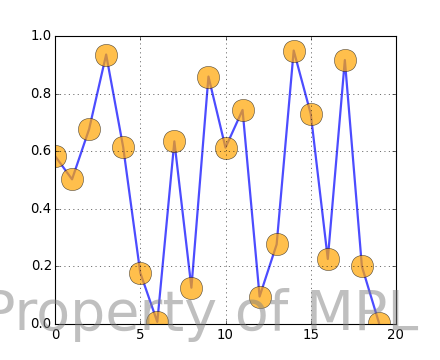
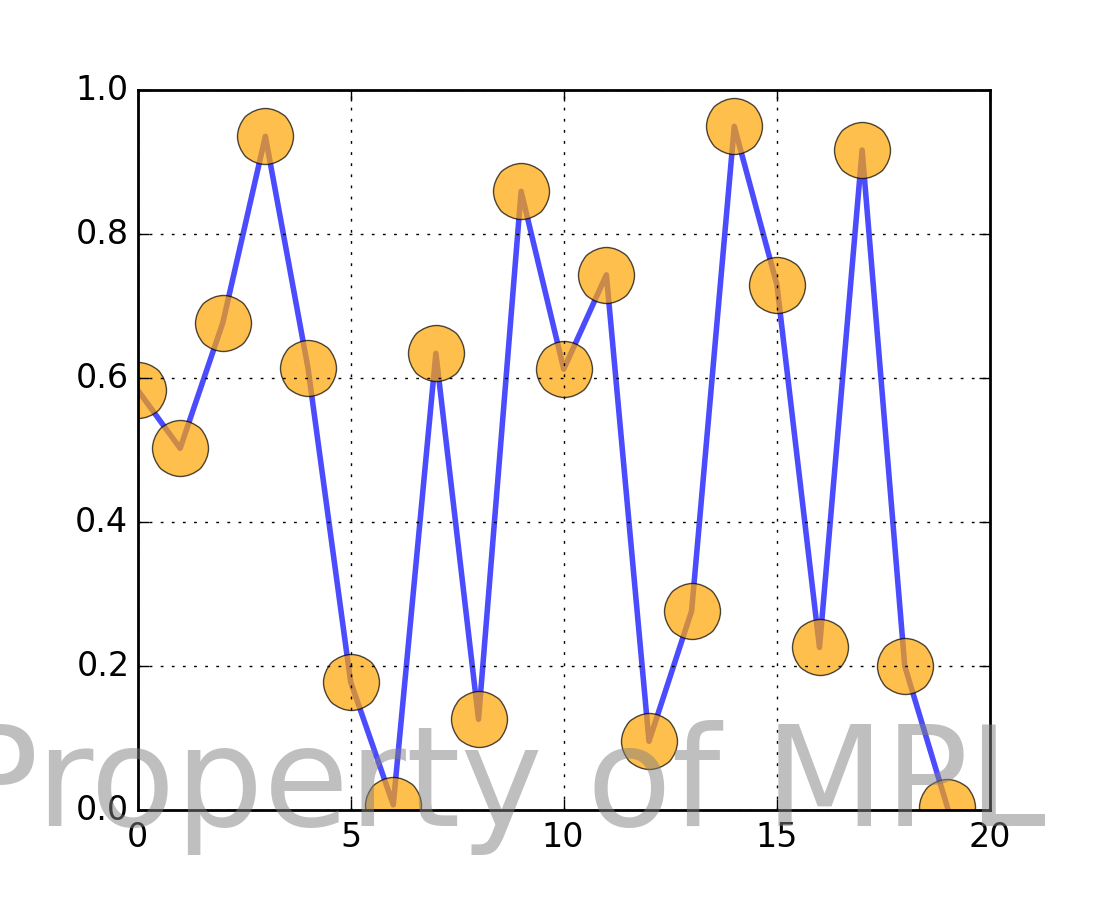
Use a Text as a watermark
"""
import numpy as np
#import matplotlib
#matplotlib.use('Agg')
import matplotlib.pyplot as plt
fig, ax = plt.subplots()
ax.plot(np.random.rand(20), '-o', ms=20, lw=2, alpha=0.7, mfc='orange')
ax.grid()
# position bottom right
fig.text(0.95, 0.05, 'Property of MPL',
fontsize=50, color='gray',
ha='right', va='bottom', alpha=0.5)
plt.show()
Keywords: python, matplotlib, pylab, example, codex (see Search examples)