
The axes_divider module provide helper classes to adjust the axes positions of set of images in the drawing time.
You first initialize the divider by specifying its grids, i.e., horizontal and vertical.
for example,:
rect = [0.2, 0.2, 0.6, 0.6]
horiz=[h0, h1, h2, h3]
vert=[v0, v1, v2]
divider = Divider(fig, rect, horiz, vert)
where, rect is a bounds of the box that will be divided and h0,..h3, v0,..v2 need to be an instance of classes in the axes_size. They have get_size method that returns a tuple of two floats. The first float is the relative size, and the second float is the absolute size. Consider a following grid.
| v0 | |||
| v1 | |||
| h0,v2 | h1 | h2 | h3 |
The height of the bottom row is always 2 (axes_divider internally assumes that the unit is inch). The first and the second rows with height ratio of 2:3. For example, if the total height of the grid 6, then the first and second row will each occupy 2/(2+3) and 3/(2+3) of (6-1) inches. The widths of columns (horiz) will be similarly determined. When aspect ratio is set, the total height (or width) will be adjusted accordingly.
The mpl_toolkits.axes_grid.axes_size contains several classes that can be used to set the horizontal and vertical configurations. For example, for the vertical configuration above will be:
from mpl_toolkits.axes_grid.axes_size import Fixed, Scaled
vert = [Fixed(2), Scaled(2), Scaled(3)]
After you set up the divider object, then you create a locator instance which will be given to the axes.:
locator = divider.new_locator(nx=0, ny=1)
ax.set_axes_locator(locator)
The return value of the new_locator method is a instance of the AxesLocator class. It is a callable object that returns the location and size of the cell at the first column and the second row. You may create a locator that spans over multiple cells.:
locator = divider.new_locator(nx=0, nx=2, ny=1)
The above locator, when called, will return the position and size of the cells spanning the first and second column and the first row. You may consider it as [0:2, 1].
See the example,
import mpl_toolkits.axes_grid.axes_size as Size
from mpl_toolkits.axes_grid import Divider
import matplotlib.pyplot as plt
fig1 = plt.figure(1, (5.5, 4.))
# the rect parameter will be ignore as we will set axes_locator
rect = (0.1, 0.1, 0.8, 0.8)
ax = [fig1.add_axes(rect, label="%d"%i) for i in range(4)]
horiz = [Size.Scaled(1.5), Size.Fixed(.5), Size.Scaled(1.),
Size.Scaled(.5)]
vert = [Size.Scaled(1.), Size.Fixed(.5), Size.Scaled(1.5)]
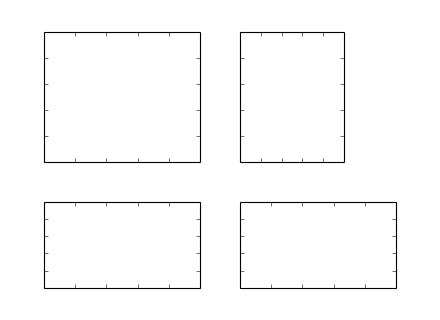
# divide the axes rectangle into grid whose size is specified by horiz * vert
divider = Divider(fig1, rect, horiz, vert, aspect=False)
ax[0].set_axes_locator(divider.new_locator(nx=0, ny=0))
ax[1].set_axes_locator(divider.new_locator(nx=0, ny=2))
ax[2].set_axes_locator(divider.new_locator(nx=2, ny=2))
ax[3].set_axes_locator(divider.new_locator(nx=2, nx1=4, ny=0))
for ax1 in ax:
plt.setp(ax1.get_xticklabels()+ax1.get_yticklabels(),
visible=False)
plt.draw()
plt.show()
(Source code, png, hires.png, pdf)

You can adjust the size of the each axes according to their x or y data limits (AxesX and AxesY), similar to the axes aspect parameter.
import mpl_toolkits.axes_grid.axes_size as Size
from mpl_toolkits.axes_grid import Divider
import matplotlib.pyplot as plt
fig1 = plt.figure(1, (5.5, 4))
# the rect parameter will be ignore as we will set axes_locator
rect = (0.1, 0.1, 0.8, 0.8)
ax = [fig1.add_axes(rect, label="%d"%i) for i in range(4)]
horiz = [Size.AxesX(ax[0]), Size.Fixed(.5), Size.AxesX(ax[1])]
vert = [Size.AxesY(ax[0]), Size.Fixed(.5), Size.AxesY(ax[2])]
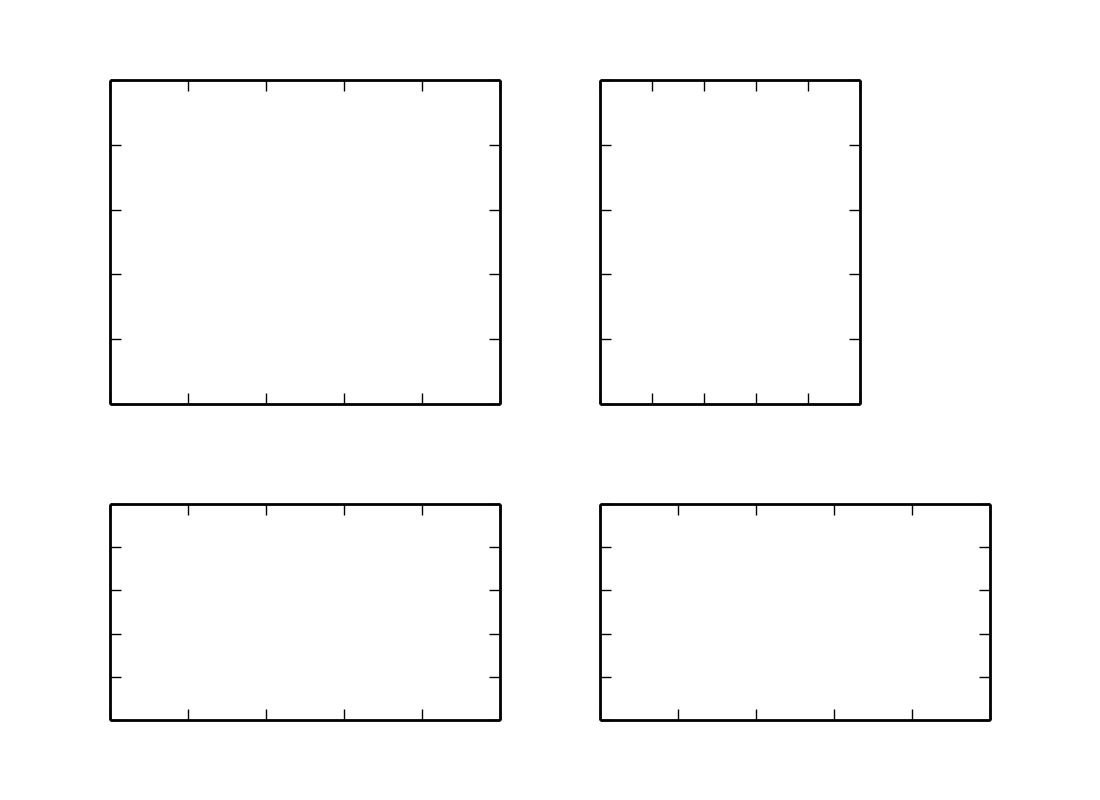
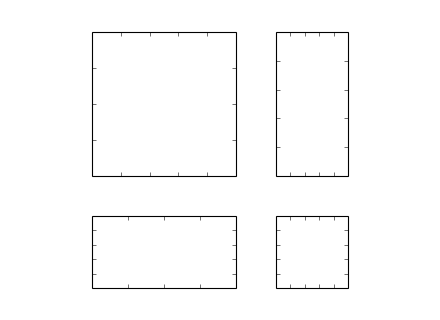
# divide the axes rectangle into grid whose size is specified by horiz * vert
divider = Divider(fig1, rect, horiz, vert, aspect=False)
ax[0].set_axes_locator(divider.new_locator(nx=0, ny=0))
ax[1].set_axes_locator(divider.new_locator(nx=2, ny=0))
ax[2].set_axes_locator(divider.new_locator(nx=0, ny=2))
ax[3].set_axes_locator(divider.new_locator(nx=2, ny=2))
ax[0].set_xlim(0, 2)
ax[1].set_xlim(0, 1)
ax[0].set_ylim(0, 1)
ax[2].set_ylim(0, 2)
divider.set_aspect(1.)
for ax1 in ax:
plt.setp(ax1.get_xticklabels()+ax1.get_yticklabels(),
visible=False)
plt.draw()
plt.show()
(Source code, png, hires.png, pdf)
