
(Source code, png, hires.png, pdf)
"""
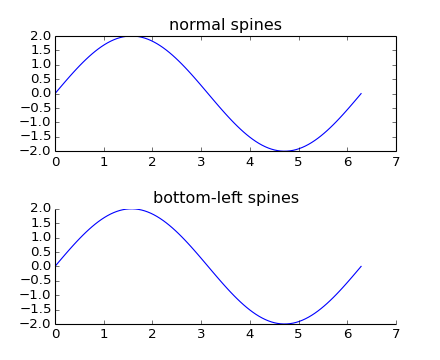
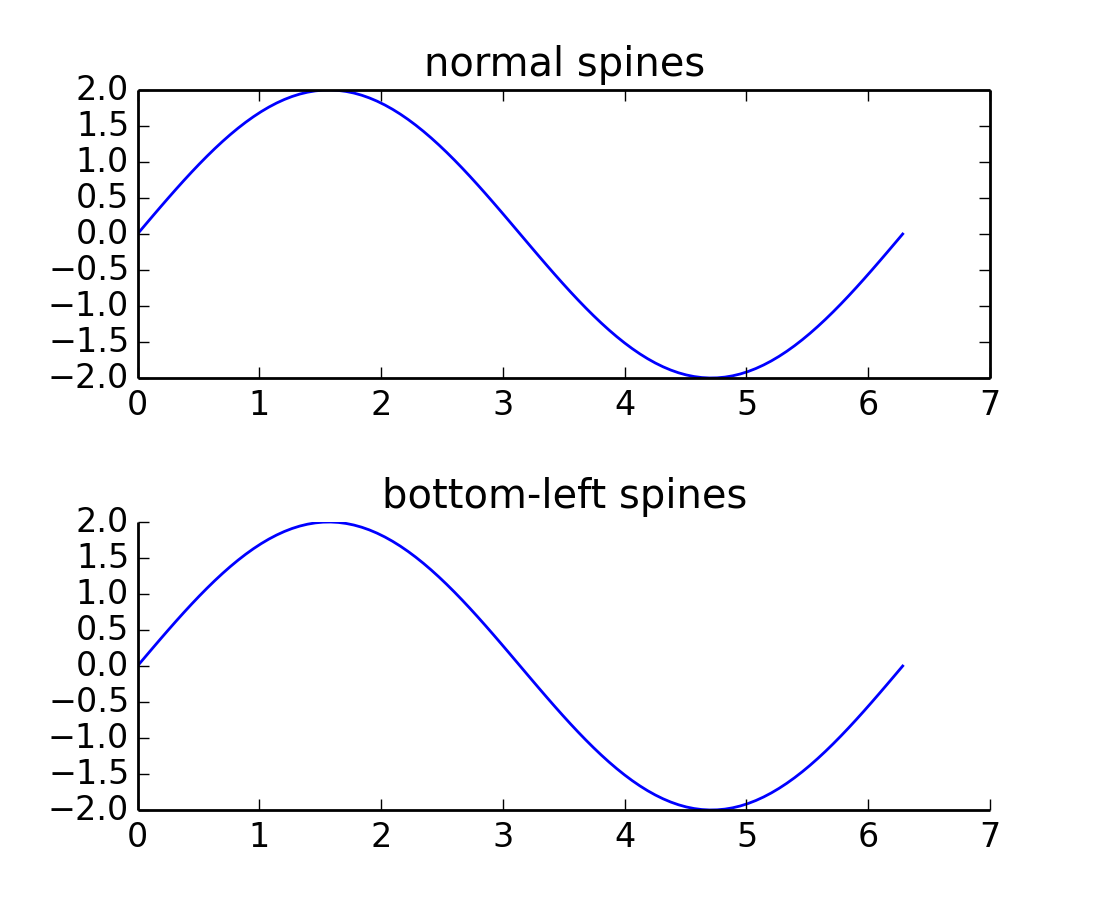
Basic demo of axis spines.
This demo compares a normal axes, with spines on all four sides, and an axes
with spines only on the left and bottom.
"""
import numpy as np
import matplotlib.pyplot as plt
x = np.linspace(0, 2 * np.pi, 100)
y = 2 * np.sin(x)
fig, (ax0, ax1) = plt.subplots(nrows=2)
ax0.plot(x, y)
ax0.set_title('normal spines')
ax1.plot(x, y)
ax1.set_title('bottom-left spines')
# Hide the right and top spines
ax1.spines['right'].set_visible(False)
ax1.spines['top'].set_visible(False)
# Only show ticks on the left and bottom spines
ax1.yaxis.set_ticks_position('left')
ax1.xaxis.set_ticks_position('bottom')
# Tweak spacing between subplots to prevent labels from overlapping
plt.subplots_adjust(hspace=0.5)
plt.show()
Keywords: python, matplotlib, pylab, example, codex (see Search examples)