
(Source code, png, hires.png, pdf)

"""
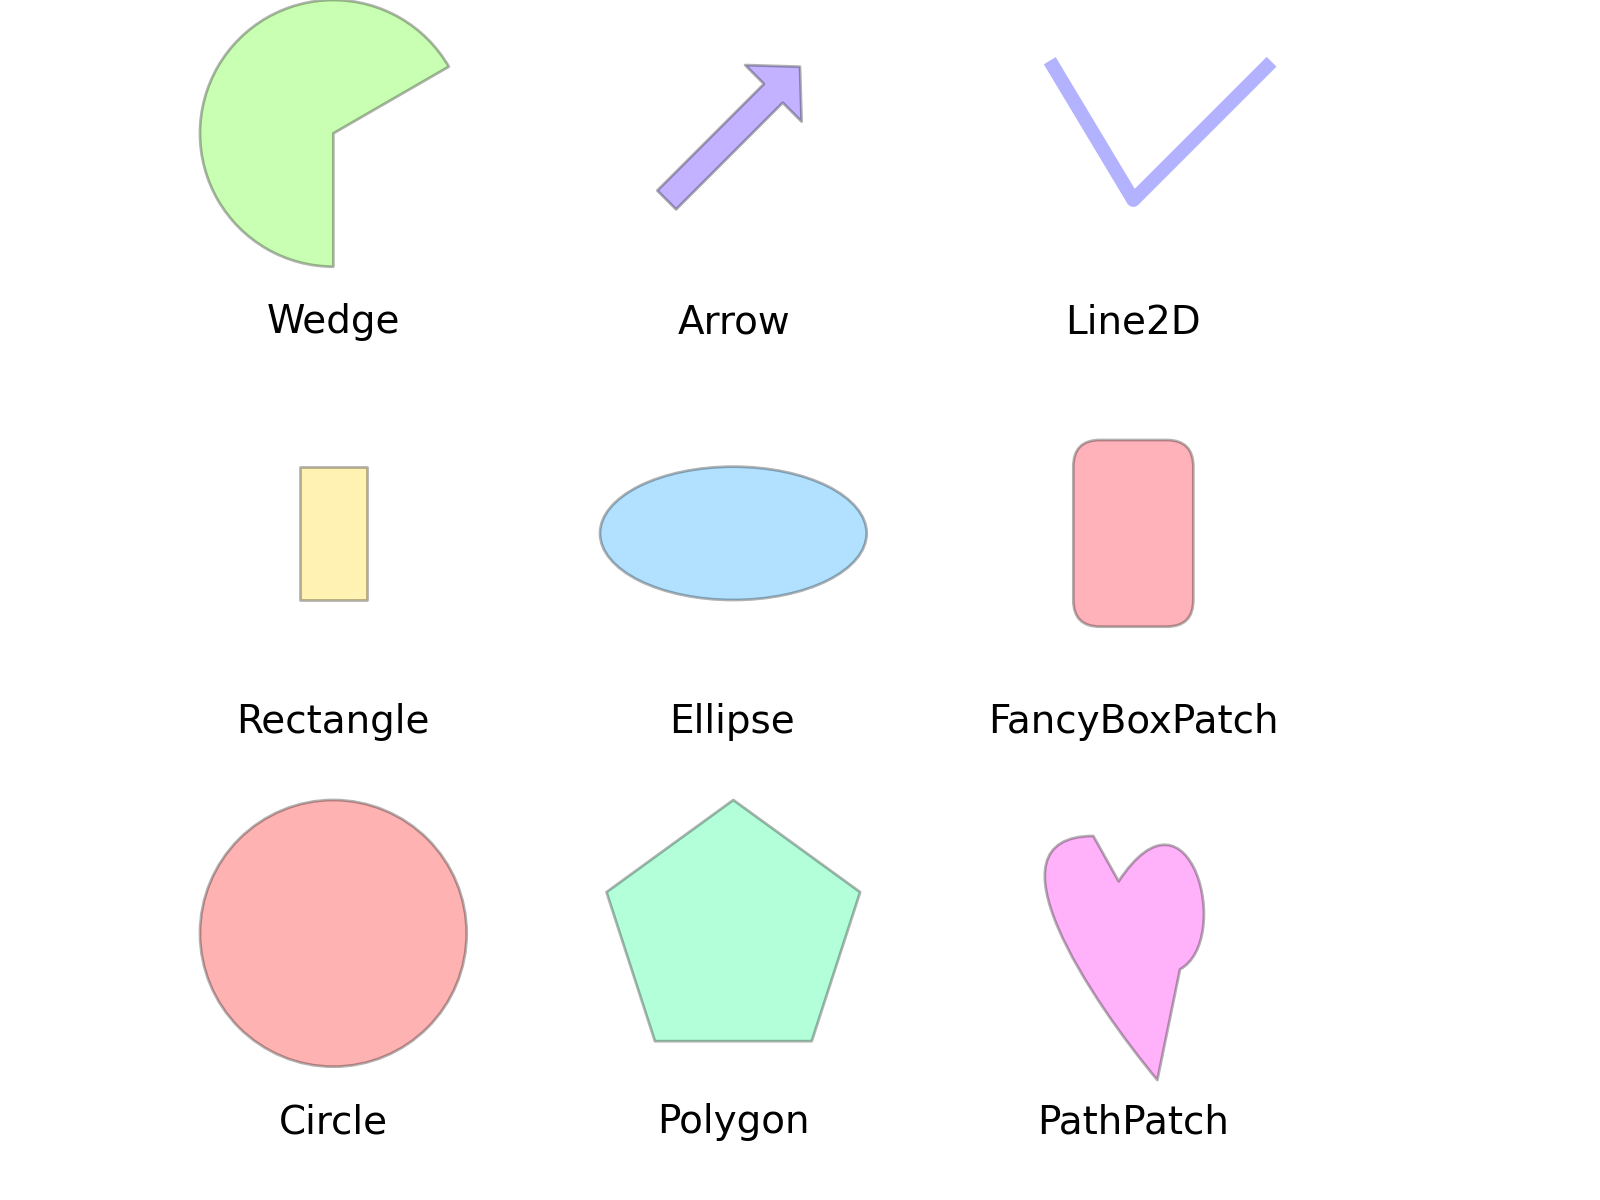
Reference for matplotlib artists
This example displays several of matplotlib's graphics primitives (artists)
drawn using matplotlib API. A full list of artists and the documentation is
available at http://matplotlib.org/api/artist_api.html.
Copyright (c) 2010, Bartosz Telenczuk
BSD License
"""
import matplotlib.pyplot as plt; plt.rcdefaults()
import numpy as np
import matplotlib.pyplot as plt
import matplotlib.path as mpath
import matplotlib.lines as mlines
import matplotlib.patches as mpatches
from matplotlib.collections import PatchCollection
def label(xy, text):
y = xy[1] - 0.15 # shift y-value for label so that it's below the artist
plt.text(xy[0], y, text, ha="center", family='sans-serif', size=14)
fig, ax = plt.subplots()
# create 3x3 grid to plot the artists
grid = np.mgrid[0.2:0.8:3j, 0.2:0.8:3j].reshape(2, -1).T
patches = []
# add a circle
circle = mpatches.Circle(grid[0], 0.1,ec="none")
patches.append(circle)
label(grid[0], "Circle")
# add a rectangle
rect = mpatches.Rectangle(grid[1] - [0.025, 0.05], 0.05, 0.1, ec="none")
patches.append(rect)
label(grid[1], "Rectangle")
# add a wedge
wedge = mpatches.Wedge(grid[2], 0.1, 30, 270, ec="none")
patches.append(wedge)
label(grid[2], "Wedge")
# add a Polygon
polygon = mpatches.RegularPolygon(grid[3], 5, 0.1)
patches.append(polygon)
label(grid[3], "Polygon")
#add an ellipse
ellipse = mpatches.Ellipse(grid[4], 0.2, 0.1)
patches.append(ellipse)
label(grid[4], "Ellipse")
#add an arrow
arrow = mpatches.Arrow(grid[5, 0]-0.05, grid[5, 1]-0.05, 0.1, 0.1, width=0.1)
patches.append(arrow)
label(grid[5], "Arrow")
# add a path patch
Path = mpath.Path
path_data = [
(Path.MOVETO, [ 0.018, -0.11 ]),
(Path.CURVE4, [-0.031, -0.051]),
(Path.CURVE4, [-0.115, 0.073]),
(Path.CURVE4, [-0.03 , 0.073]),
(Path.LINETO, [-0.011, 0.039]),
(Path.CURVE4, [ 0.043, 0.121]),
(Path.CURVE4, [ 0.075, -0.005]),
(Path.CURVE4, [ 0.035, -0.027]),
(Path.CLOSEPOLY, [0.018, -0.11])
]
codes, verts = zip(*path_data)
path = mpath.Path(verts + grid[6], codes)
patch = mpatches.PathPatch(path)
patches.append(patch)
label(grid[6], "PathPatch")
# add a fancy box
fancybox = mpatches.FancyBboxPatch(
grid[7] - [0.025, 0.05], 0.05, 0.1,
boxstyle=mpatches.BoxStyle("Round", pad=0.02))
patches.append(fancybox)
label(grid[7], "FancyBoxPatch")
# add a line
x,y = np.array([[-0.06, 0.0, 0.1], [0.05, -0.05, 0.05]])
line = mlines.Line2D(x + grid[8, 0], y + grid[8, 1], lw=5., alpha=0.3)
label(grid[8], "Line2D")
colors = np.linspace(0, 1, len(patches))
collection = PatchCollection(patches, cmap=plt.cm.hsv, alpha=0.3)
collection.set_array(np.array(colors))
ax.add_collection(collection)
ax.add_line(line)
plt.subplots_adjust(left=0, right=1, bottom=0, top=1)
plt.axis('equal')
plt.axis('off')
plt.show()
Keywords: python, matplotlib, pylab, example, codex (see Search examples)