
"""
Pseudocolor plots of unstructured triangular grids.
"""
import matplotlib.pyplot as plt
import matplotlib.tri as tri
import numpy as np
import math
# Creating a Triangulation without specifying the triangles results in the
# Delaunay triangulation of the points.
# First create the x and y coordinates of the points.
n_angles = 36
n_radii = 8
min_radius = 0.25
radii = np.linspace(min_radius, 0.95, n_radii)
angles = np.linspace(0, 2*math.pi, n_angles, endpoint=False)
angles = np.repeat(angles[...,np.newaxis], n_radii, axis=1)
angles[:,1::2] += math.pi/n_angles
x = (radii*np.cos(angles)).flatten()
y = (radii*np.sin(angles)).flatten()
z = (np.cos(radii)*np.cos(angles*3.0)).flatten()
# Create the Triangulation; no triangles so Delaunay triangulation created.
triang = tri.Triangulation(x, y)
# Mask off unwanted triangles.
xmid = x[triang.triangles].mean(axis=1)
ymid = y[triang.triangles].mean(axis=1)
mask = np.where(xmid*xmid + ymid*ymid < min_radius*min_radius, 1, 0)
triang.set_mask(mask)
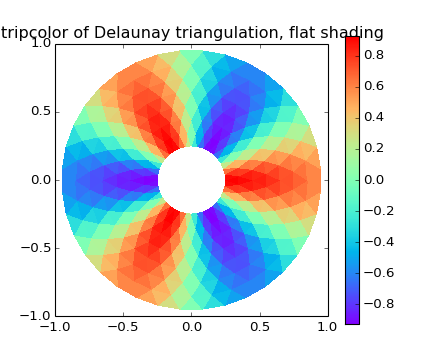
# tripcolor plot.
plt.figure()
plt.gca().set_aspect('equal')
plt.tripcolor(triang, z, shading='flat', cmap=plt.cm.rainbow)
plt.colorbar()
plt.title('tripcolor of Delaunay triangulation, flat shading')
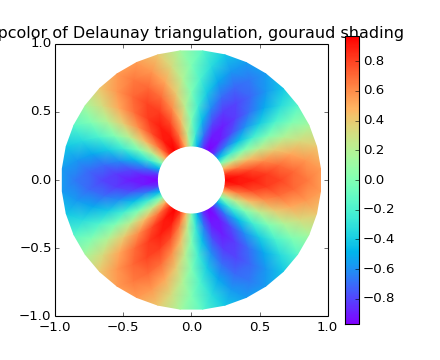
# Illustrate Gouraud shading.
plt.figure()
plt.gca().set_aspect('equal')
plt.tripcolor(triang, z, shading='gouraud', cmap=plt.cm.rainbow)
plt.colorbar()
plt.title('tripcolor of Delaunay triangulation, gouraud shading')
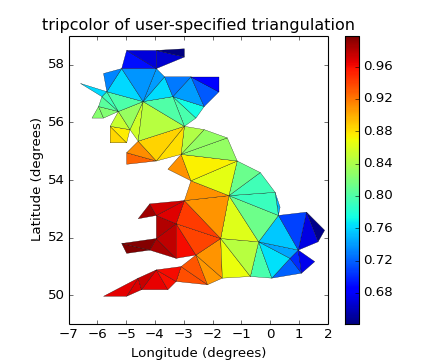
# You can specify your own triangulation rather than perform a Delaunay
# triangulation of the points, where each triangle is given by the indices of
# the three points that make up the triangle, ordered in either a clockwise or
# anticlockwise manner.
xy = np.asarray([
[-0.101,0.872],[-0.080,0.883],[-0.069,0.888],[-0.054,0.890],[-0.045,0.897],
[-0.057,0.895],[-0.073,0.900],[-0.087,0.898],[-0.090,0.904],[-0.069,0.907],
[-0.069,0.921],[-0.080,0.919],[-0.073,0.928],[-0.052,0.930],[-0.048,0.942],
[-0.062,0.949],[-0.054,0.958],[-0.069,0.954],[-0.087,0.952],[-0.087,0.959],
[-0.080,0.966],[-0.085,0.973],[-0.087,0.965],[-0.097,0.965],[-0.097,0.975],
[-0.092,0.984],[-0.101,0.980],[-0.108,0.980],[-0.104,0.987],[-0.102,0.993],
[-0.115,1.001],[-0.099,0.996],[-0.101,1.007],[-0.090,1.010],[-0.087,1.021],
[-0.069,1.021],[-0.052,1.022],[-0.052,1.017],[-0.069,1.010],[-0.064,1.005],
[-0.048,1.005],[-0.031,1.005],[-0.031,0.996],[-0.040,0.987],[-0.045,0.980],
[-0.052,0.975],[-0.040,0.973],[-0.026,0.968],[-0.020,0.954],[-0.006,0.947],
[ 0.003,0.935],[ 0.006,0.926],[ 0.005,0.921],[ 0.022,0.923],[ 0.033,0.912],
[ 0.029,0.905],[ 0.017,0.900],[ 0.012,0.895],[ 0.027,0.893],[ 0.019,0.886],
[ 0.001,0.883],[-0.012,0.884],[-0.029,0.883],[-0.038,0.879],[-0.057,0.881],
[-0.062,0.876],[-0.078,0.876],[-0.087,0.872],[-0.030,0.907],[-0.007,0.905],
[-0.057,0.916],[-0.025,0.933],[-0.077,0.990],[-0.059,0.993] ])
x = xy[:,0]*180/3.14159
y = xy[:,1]*180/3.14159
triangles = np.asarray([
[67,66, 1],[65, 2,66],[ 1,66, 2],[64, 2,65],[63, 3,64],[60,59,57],
[ 2,64, 3],[ 3,63, 4],[ 0,67, 1],[62, 4,63],[57,59,56],[59,58,56],
[61,60,69],[57,69,60],[ 4,62,68],[ 6, 5, 9],[61,68,62],[69,68,61],
[ 9, 5,70],[ 6, 8, 7],[ 4,70, 5],[ 8, 6, 9],[56,69,57],[69,56,52],
[70,10, 9],[54,53,55],[56,55,53],[68,70, 4],[52,56,53],[11,10,12],
[69,71,68],[68,13,70],[10,70,13],[51,50,52],[13,68,71],[52,71,69],
[12,10,13],[71,52,50],[71,14,13],[50,49,71],[49,48,71],[14,16,15],
[14,71,48],[17,19,18],[17,20,19],[48,16,14],[48,47,16],[47,46,16],
[16,46,45],[23,22,24],[21,24,22],[17,16,45],[20,17,45],[21,25,24],
[27,26,28],[20,72,21],[25,21,72],[45,72,20],[25,28,26],[44,73,45],
[72,45,73],[28,25,29],[29,25,31],[43,73,44],[73,43,40],[72,73,39],
[72,31,25],[42,40,43],[31,30,29],[39,73,40],[42,41,40],[72,33,31],
[32,31,33],[39,38,72],[33,72,38],[33,38,34],[37,35,38],[34,38,35],
[35,37,36] ])
xmid = x[triangles].mean(axis=1)
ymid = y[triangles].mean(axis=1)
x0 = -5
y0 = 52
zfaces = np.exp(-0.01*( (xmid-x0)*(xmid-x0) + (ymid-y0)*(ymid-y0) ))
# Rather than create a Triangulation object, can simply pass x, y and triangles
# arrays to tripcolor directly. It would be better to use a Triangulation object
# if the same triangulation was to be used more than once to save duplicated
# calculations.
# Can specify one color value per face rather than one per point by using the
# facecolors kwarg.
plt.figure()
plt.gca().set_aspect('equal')
plt.tripcolor(x, y, triangles, facecolors=zfaces, edgecolors='k')
plt.colorbar()
plt.title('tripcolor of user-specified triangulation')
plt.xlabel('Longitude (degrees)')
plt.ylabel('Latitude (degrees)')
plt.show()
Keywords: python, matplotlib, pylab, example, codex (see Search examples)

