
(Source code, png, hires.png, pdf)
#!/usr/bin/env python
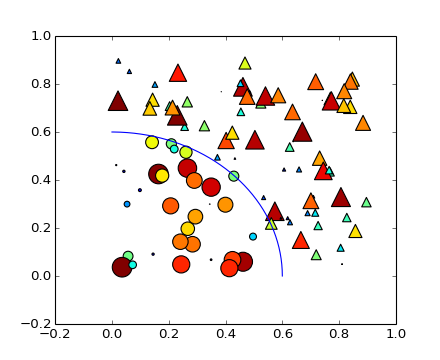
from pylab import *
N = 100
r0 = 0.6
x = 0.9*rand(N)
y = 0.9*rand(N)
area = pi*(10 * rand(N))**2 # 0 to 10 point radiuses
c = sqrt(area)
r = sqrt(x*x+y*y)
area1 = ma.masked_where(r < r0, area)
area2 = ma.masked_where(r >= r0, area)
scatter(x,y,s=area1, marker='^', c=c, hold='on')
scatter(x,y,s=area2, marker='o', c=c)
# Show the boundary between the regions:
theta = arange(0, pi/2, 0.01)
plot(r0*cos(theta), r0*sin(theta))
show()
Keywords: python, matplotlib, pylab, example, codex (see Search examples)