
(Source code, png, hires.png, pdf)

from __future__ import print_function
from matplotlib.dates import strpdate2num
#from matplotlib.mlab import load
import numpy as np
from pylab import figure, show
import matplotlib.cbook as cbook
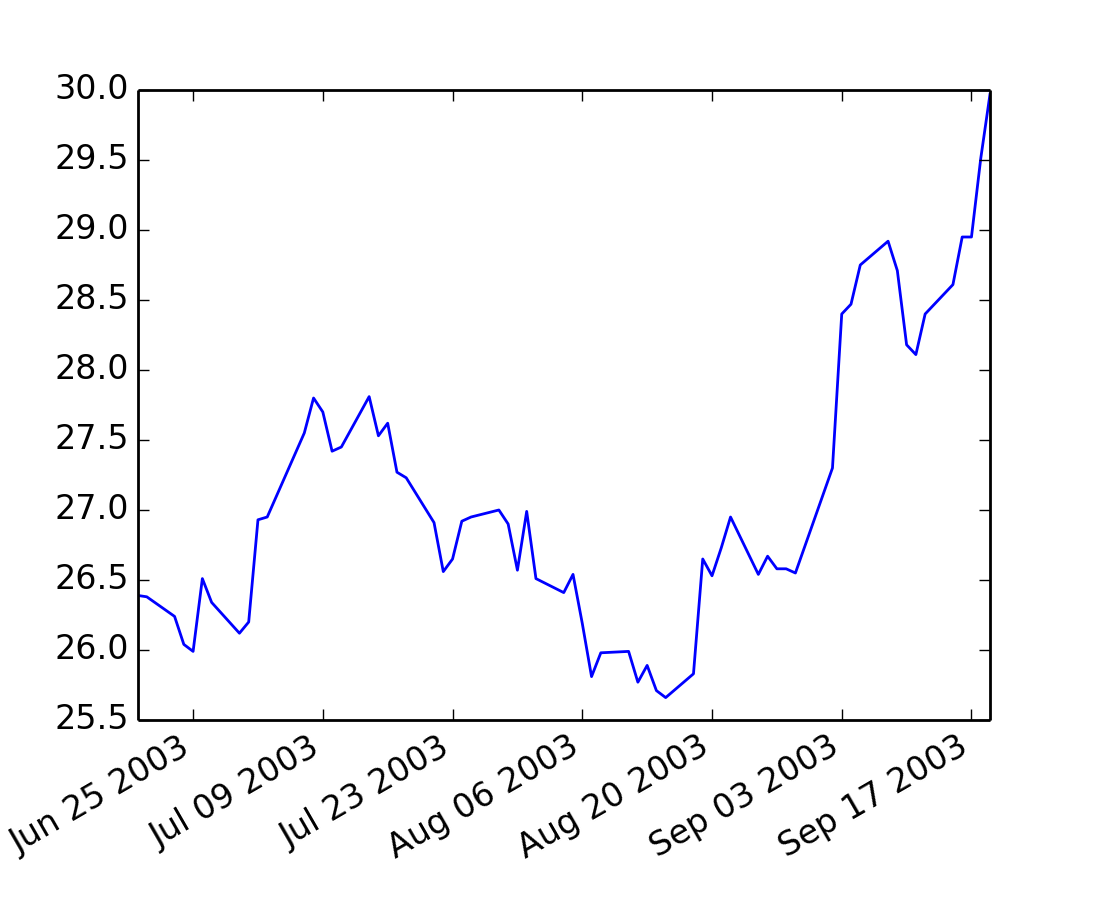
datafile = cbook.get_sample_data('msft.csv', asfileobj=False)
print('loading', datafile)
dates, closes = np.loadtxt(
datafile, delimiter=',',
converters={0:strpdate2num('%d-%b-%y')},
skiprows=1, usecols=(0,2), unpack=True)
fig = figure()
ax = fig.add_subplot(111)
ax.plot_date(dates, closes, '-')
fig.autofmt_xdate()
show()
Keywords: python, matplotlib, pylab, example, codex (see Search examples)