
(Source code, png, hires.png, pdf)

#!/usr/bin/env python
"""
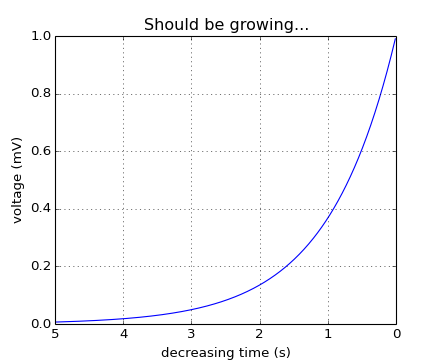
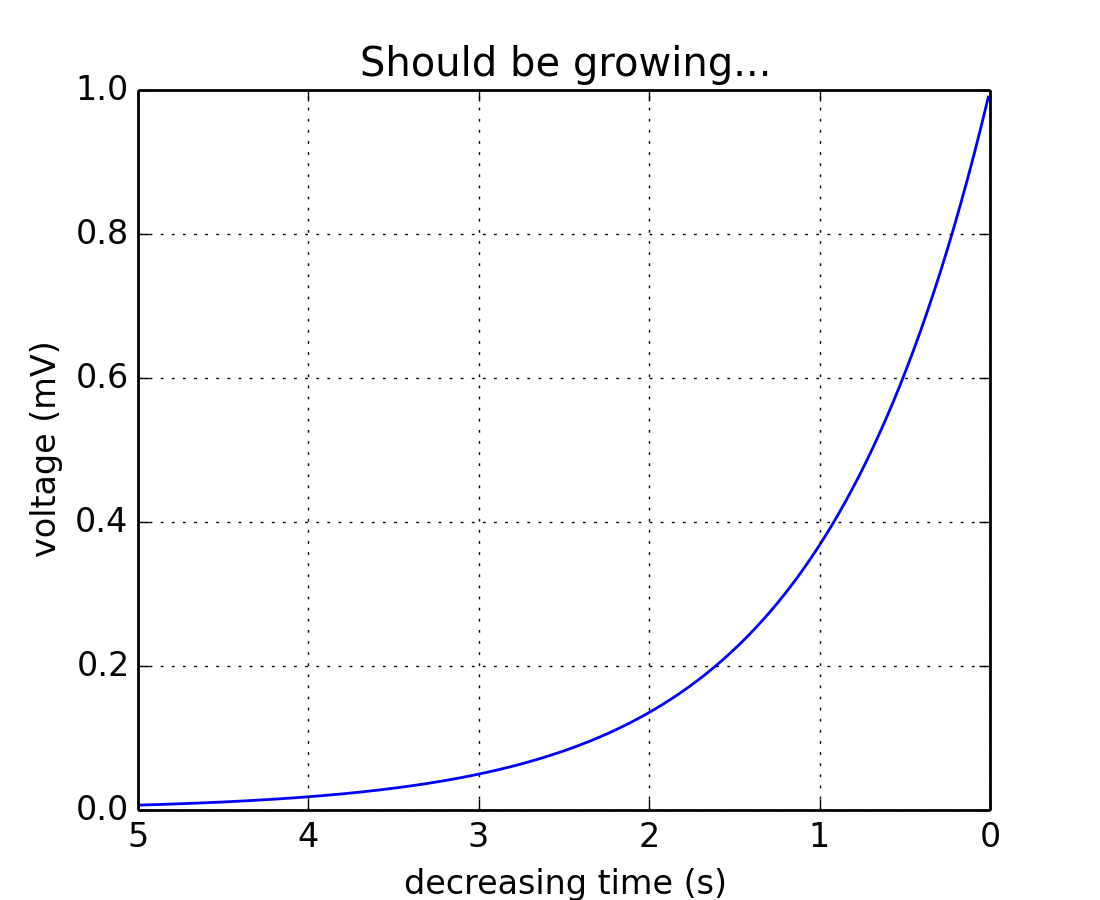
You can use decreasing axes by flipping the normal order of the axis
limits
"""
from pylab import *
t = arange(0.01, 5.0, 0.01)
s = exp(-t)
plot(t, s)
xlim(5,0) # decreasing time
xlabel('decreasing time (s)')
ylabel('voltage (mV)')
title('Should be growing...')
grid(True)
show()
Keywords: python, matplotlib, pylab, example, codex (see Search examples)