
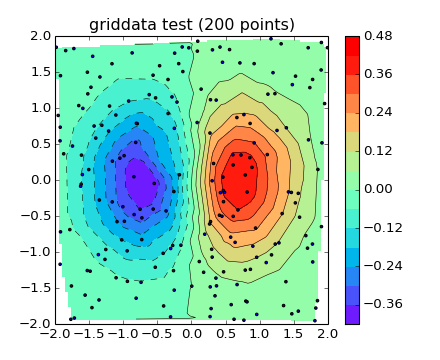
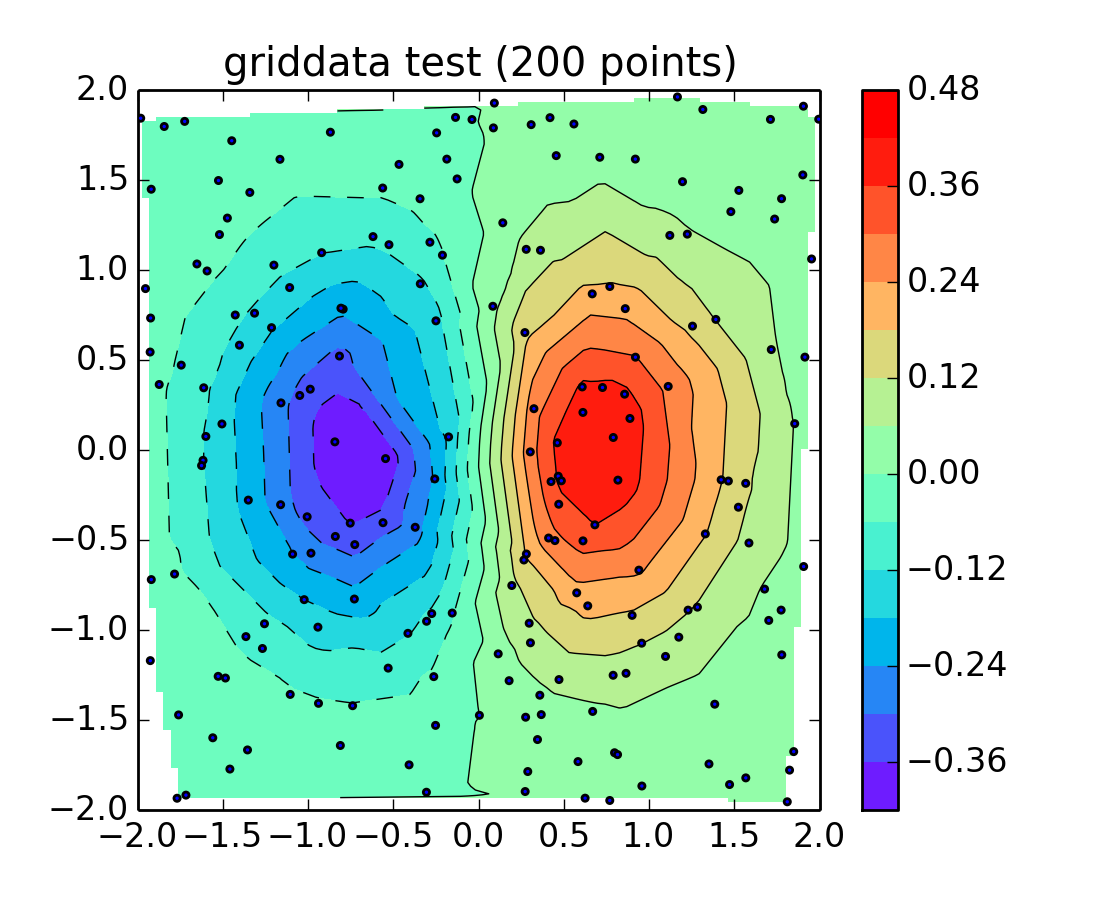
(Source code, png, hires.png, pdf)
()
from numpy.random import uniform, seed
from matplotlib.mlab import griddata
import matplotlib.pyplot as plt
import numpy as np
# make up data.
#npts = int(raw_input('enter # of random points to plot:'))
seed(0)
npts = 200
x = uniform(-2,2,npts)
y = uniform(-2,2,npts)
z = x*np.exp(-x**2-y**2)
# define grid.
xi = np.linspace(-2.1,2.1,100)
yi = np.linspace(-2.1,2.1,200)
# grid the data.
zi = griddata(x,y,z,xi,yi,interp='linear')
# contour the gridded data, plotting dots at the nonuniform data points.
CS = plt.contour(xi,yi,zi,15,linewidths=0.5,colors='k')
CS = plt.contourf(xi,yi,zi,15,cmap=plt.cm.rainbow,
                  vmax=abs(zi).max(), vmin=-abs(zi).max())
plt.colorbar() # draw colorbar
# plot data points.
plt.scatter(x,y,marker='o',c='b',s=5,zorder=10)
plt.xlim(-2,2)
plt.ylim(-2,2)
plt.title('griddata test (%d points)' % npts)
plt.show()

# test case that scikits.delaunay fails on, but natgrid passes..
#data = np.array([[-1, -1], [-1, 0], [-1, 1],
#                 [ 0, -1], [ 0, 0], [ 0, 1],
#                 [ 1, -1 - np.finfo(np.float_).eps], [ 1, 0], [ 1, 1],
#                ])
#x = data[:,0]
#y = data[:,1]
#z = x*np.exp(-x**2-y**2)
## define grid.
#xi = np.linspace(-1.1,1.1,100)
#yi = np.linspace(-1.1,1.1,100)
## grid the data.
#zi = griddata(x,y,z,xi,yi)
Keywords: python, matplotlib, pylab, example, codex (see Search examples)