
(Source code, png, hires.png, pdf)

#!/usr/bin/env python
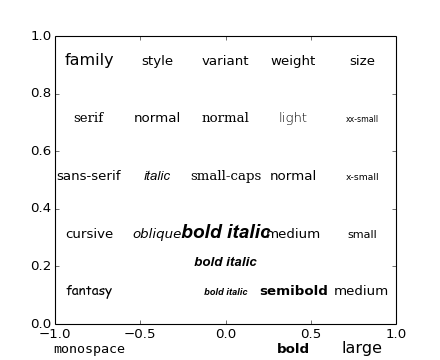
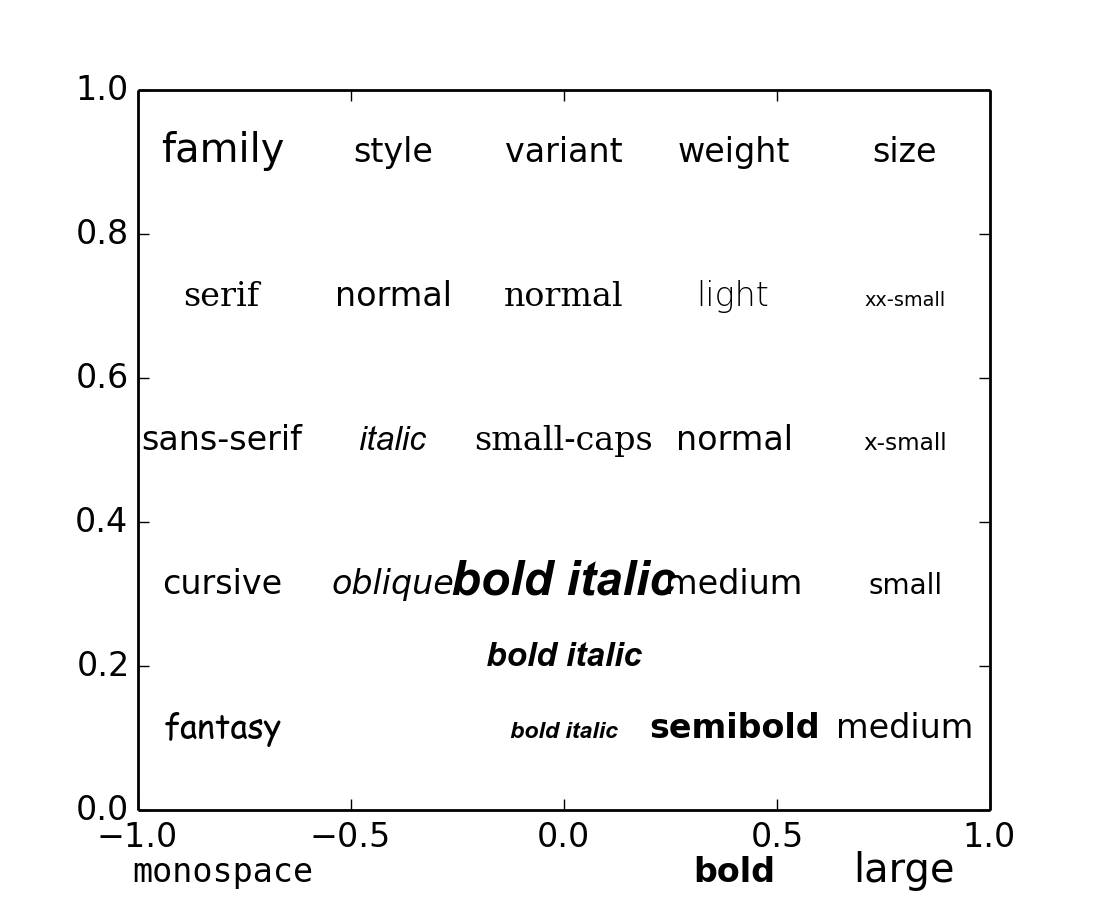
"""
Same as fonts_demo using kwargs. If you prefer a more pythonic, OO
style of coding, see examples/fonts_demo.py.
"""
from matplotlib.font_manager import FontProperties
from pylab import *
subplot(111, axisbg='w')
alignment = {'horizontalalignment':'center', 'verticalalignment':'baseline'}
### Show family options
family = ['serif', 'sans-serif', 'cursive', 'fantasy', 'monospace']
t = text(-0.8, 0.9, 'family', size='large', **alignment)
yp = [0.7, 0.5, 0.3, 0.1, -0.1, -0.3, -0.5]
for k in range(5):
if k == 2:
t = text(-0.8, yp[k], family[k], family=family[k],
name='Script MT', **alignment)
else:
t = text(-0.8, yp[k], family[k], family=family[k], **alignment)
### Show style options
style = ['normal', 'italic', 'oblique']
t = text(-0.4, 0.9, 'style', **alignment)
for k in range(3):
t = text(-0.4, yp[k], style[k], family='sans-serif', style=style[k],
**alignment)
### Show variant options
variant= ['normal', 'small-caps']
t = text(0.0, 0.9, 'variant', **alignment)
for k in range(2):
t = text( 0.0, yp[k], variant[k], family='serif', variant=variant[k],
**alignment)
### Show weight options
weight = ['light', 'normal', 'medium', 'semibold', 'bold', 'heavy', 'black']
t = text( 0.4, 0.9, 'weight', **alignment)
for k in range(7):
t = text( 0.4, yp[k], weight[k], weight=weight[k],
**alignment)
### Show size options
size = ['xx-small', 'x-small', 'small', 'medium', 'large',
'x-large', 'xx-large']
t = text( 0.8, 0.9, 'size', **alignment)
for k in range(7):
t = text( 0.8, yp[k], size[k], size=size[k],
**alignment)
x = 0
### Show bold italic
t = text(x, 0.1, 'bold italic', style='italic',
weight='bold', size='x-small',
**alignment)
t = text(x, 0.2, 'bold italic',
style = 'italic', weight='bold', size='medium',
**alignment)
t = text(x, 0.3, 'bold italic',
style='italic', weight='bold', size='x-large',
**alignment)
axis([-1, 1, 0, 1])
show()
Keywords: python, matplotlib, pylab, example, codex (see Search examples)