
(Source code, png, hires.png, pdf)

#!/usr/bin/env python
"""
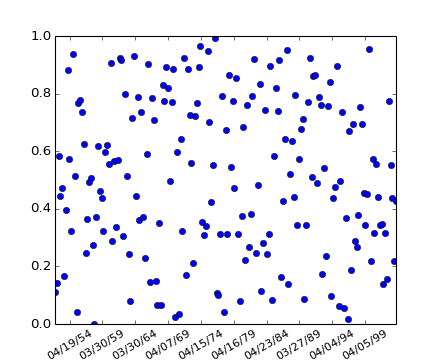
Show how to use an rrule instance to make a custom date ticker - here
we put a tick mark on every 5th easter
See https://moin.conectiva.com.br/DateUtil for help with rrules
"""
import matplotlib.pyplot as plt
from matplotlib.dates import YEARLY, DateFormatter, rrulewrapper, RRuleLocator, drange
import numpy as np
import datetime
# tick every 5th easter
rule = rrulewrapper(YEARLY, byeaster=1, interval=5)
loc = RRuleLocator(rule)
formatter = DateFormatter('%m/%d/%y')
date1 = datetime.date( 1952, 1, 1 )
date2 = datetime.date( 2004, 4, 12 )
delta = datetime.timedelta(days=100)
dates = drange(date1, date2, delta)
s = np.random.rand(len(dates)) # make up some random y values
fig, ax = plt.subplots()
plt.plot_date(dates, s)
ax.xaxis.set_major_locator(loc)
ax.xaxis.set_major_formatter(formatter)
labels = ax.get_xticklabels()
plt.setp(labels, rotation=30, fontsize=10)
plt.show()
Keywords: python, matplotlib, pylab, example, codex (see Search examples)