
(Source code, png, hires.png, pdf)

import matplotlib.pyplot as plt
import numpy as np
def fakeBootStrapper(n):
'''
This is just a placeholder for the user's method of
bootstrapping the median and its confidence intervals.
Returns an arbitrary median and confidence intervals
packed into a tuple
'''
if n == 1:
med = 0.1
CI = (-0.25, 0.25)
else:
med = 0.2
CI = (-0.35, 0.50)
return med, CI
np.random.seed(2)
inc = 0.1
e1 = np.random.normal(0, 1, size=(500,))
e2 = np.random.normal(0, 1, size=(500,))
e3 = np.random.normal(0, 1 + inc, size=(500,))
e4 = np.random.normal(0, 1 + 2*inc, size=(500,))
treatments = [e1,e2,e3,e4]
med1, CI1 = fakeBootStrapper(1)
med2, CI2 = fakeBootStrapper(2)
medians = [None, None, med1, med2]
conf_intervals = [None, None, CI1, CI2]
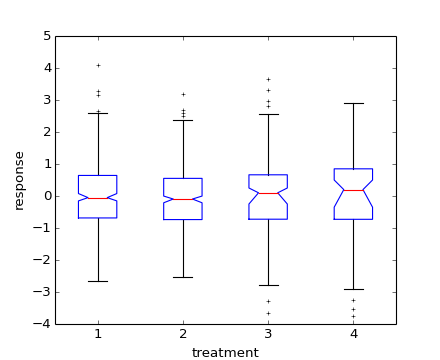
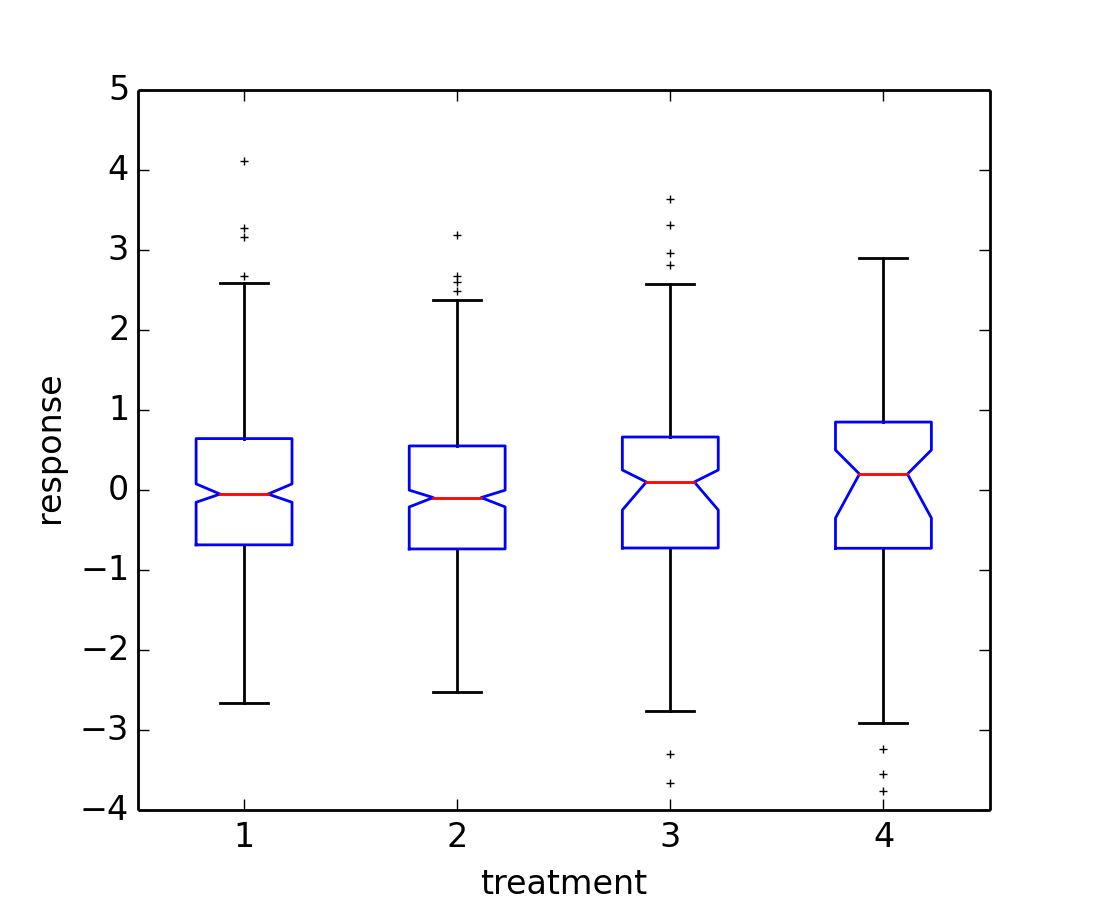
fig, ax = plt.subplots()
pos = np.array(range(len(treatments)))+1
bp = ax.boxplot(treatments, sym='k+', positions=pos,
notch=1, bootstrap=5000,
usermedians=medians,
conf_intervals=conf_intervals)
ax.set_xlabel('treatment')
ax.set_ylabel('response')
plt.setp(bp['whiskers'], color='k', linestyle='-' )
plt.setp(bp['fliers'], markersize=3.0)
plt.show()
Keywords: python, matplotlib, pylab, example, codex (see Search examples)