
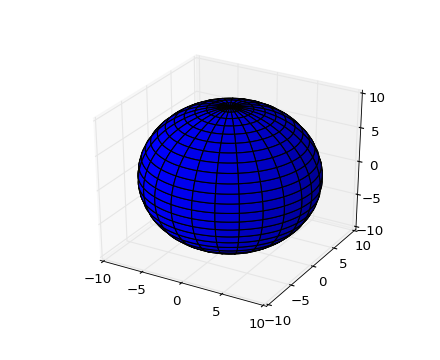
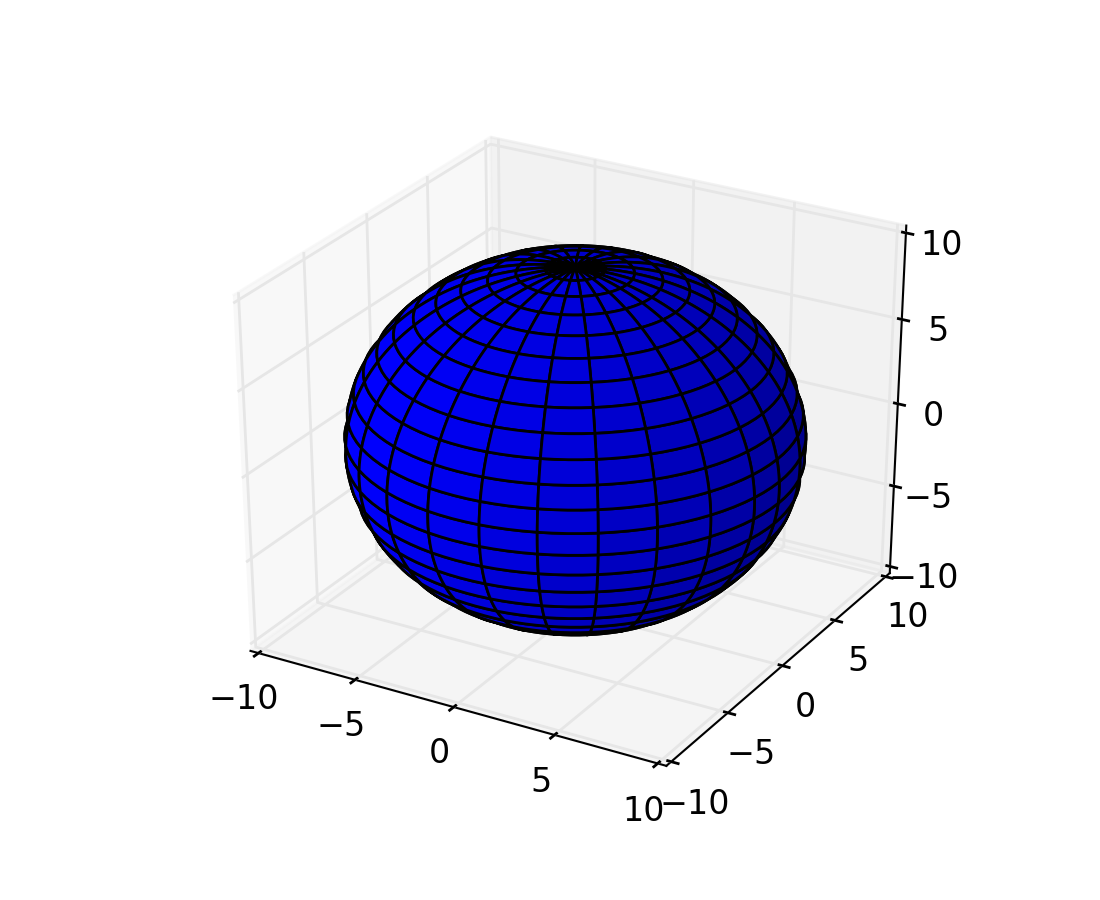
(Source code, png, hires.png, pdf)

from mpl_toolkits.mplot3d import Axes3D
import matplotlib.pyplot as plt
import numpy as np

fig = plt.figure()
ax = fig.add_subplot(111, projection='3d')

u = np.linspace(0, 2 * np.pi, 100)
v = np.linspace(0, np.pi, 100)

x = 10 * np.outer(np.cos(u), np.sin(v))
y = 10 * np.outer(np.sin(u), np.sin(v))
z = 10 * np.outer(np.ones(np.size(u)), np.cos(v))
ax.plot_surface(x, y, z,  rstride=4, cstride=4, color='b')

plt.show()
Keywords: python, matplotlib, pylab, example, codex (see Search examples)