
(Source code, png, hires.png, pdf)
"""
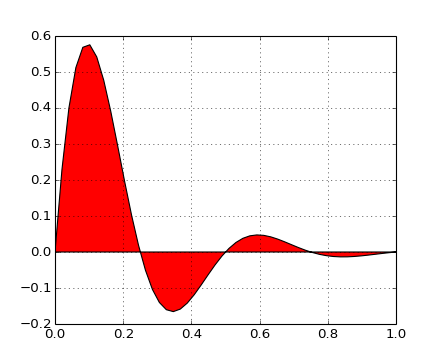
Simple demo of the fill function.
"""
import numpy as np
import matplotlib.pyplot as plt
x = np.linspace(0, 1)
y = np.sin(4 * np.pi * x) * np.exp(-5 * x)
plt.fill(x, y, 'r')
plt.grid(True)
plt.show()
Keywords: python, matplotlib, pylab, example, codex (see Search examples)