
(Source code, png, hires.png, pdf)

"""
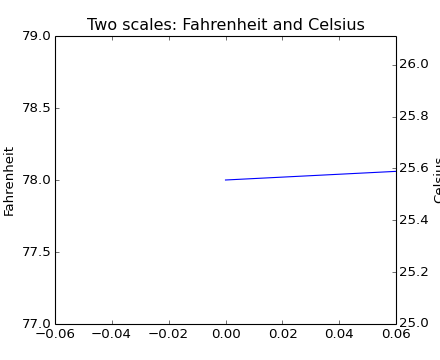
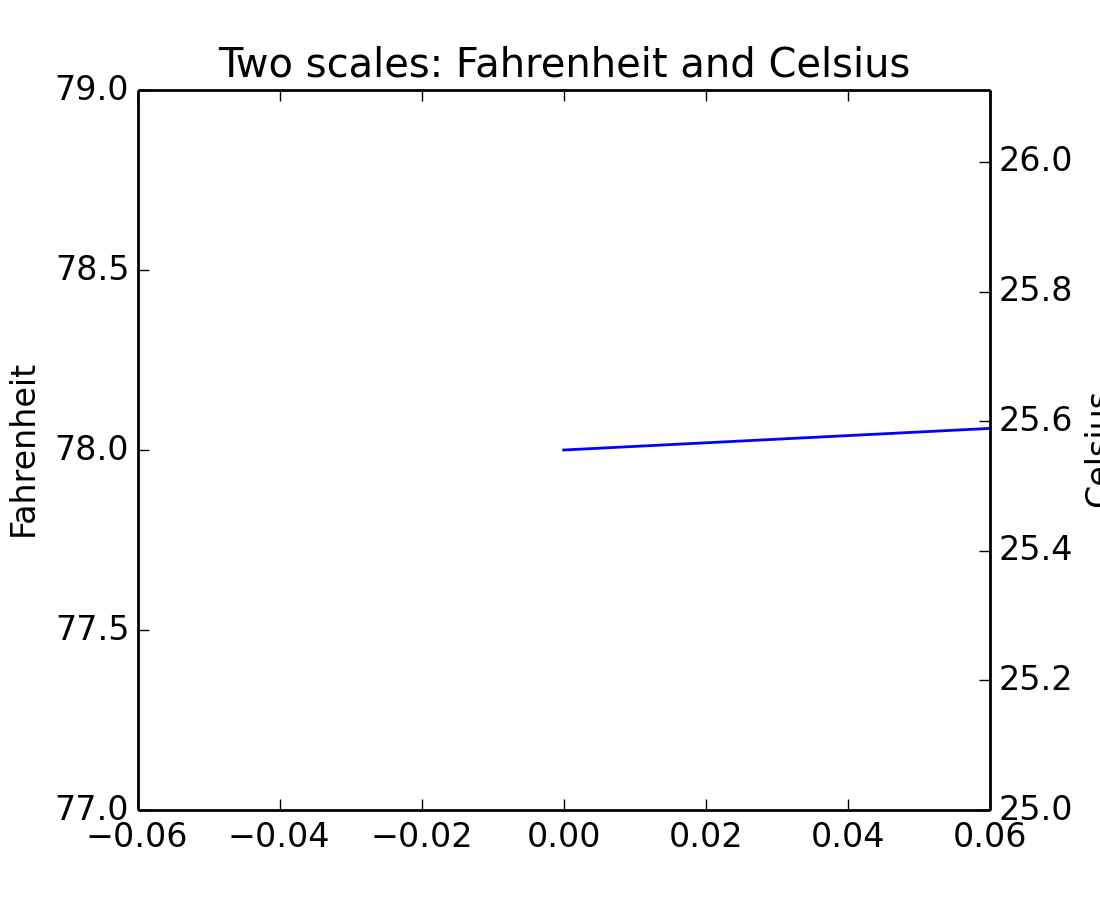
Show how to display two scales on the left and right y axis -- Fahrenheit and Celsius
"""
import matplotlib.pyplot as plt
fig, ax1 = plt.subplots() # ax1 is the Fahrenheit scale
ax2 = ax1.twinx() # ax2 is the Celsius scale
def Tc(Tf):
return (5./9.)*(Tf-32)
def update_ax2(ax1):
y1, y2 = ax1.get_ylim()
ax2.set_ylim(Tc(y1), Tc(y2))
ax2.figure.canvas.draw()
# automatically update ylim of ax2 when ylim of ax1 changes.
ax1.callbacks.connect("ylim_changed", update_ax2)
ax1.plot([78, 79, 79, 77])
ax1.set_title('Two scales: Fahrenheit and Celsius')
ax1.set_ylabel('Fahrenheit')
ax2.set_ylabel('Celsius')
plt.show()
Keywords: python, matplotlib, pylab, example, codex (see Search examples)