
(Source code, png, hires.png, pdf)
"""
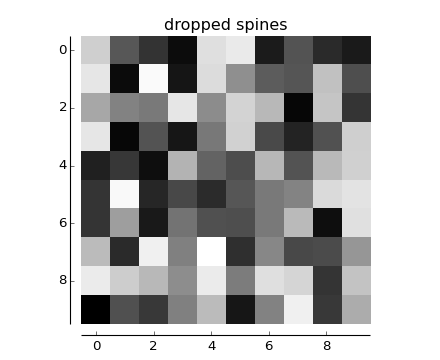
Demo of spines offset from the axes (a.k.a. "dropped spines").
"""
import numpy as np
import matplotlib.pyplot as plt
fig, ax = plt.subplots()
image = np.random.uniform(size=(10, 10))
ax.imshow(image, cmap=plt.cm.gray, interpolation='nearest')
ax.set_title('dropped spines')
# Move left and bottom spines outward by 10 points
ax.spines['left'].set_position(('outward', 10))
ax.spines['bottom'].set_position(('outward', 10))
# Hide the right and top spines
ax.spines['right'].set_visible(False)
ax.spines['top'].set_visible(False)
# Only show ticks on the left and bottom spines
ax.yaxis.set_ticks_position('left')
ax.xaxis.set_ticks_position('bottom')
plt.show()
Keywords: python, matplotlib, pylab, example, codex (see Search examples)