
(Source code, png, hires.png, pdf)
"""
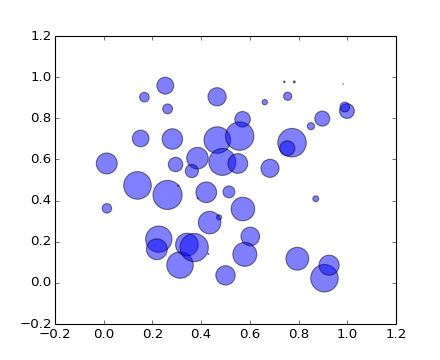
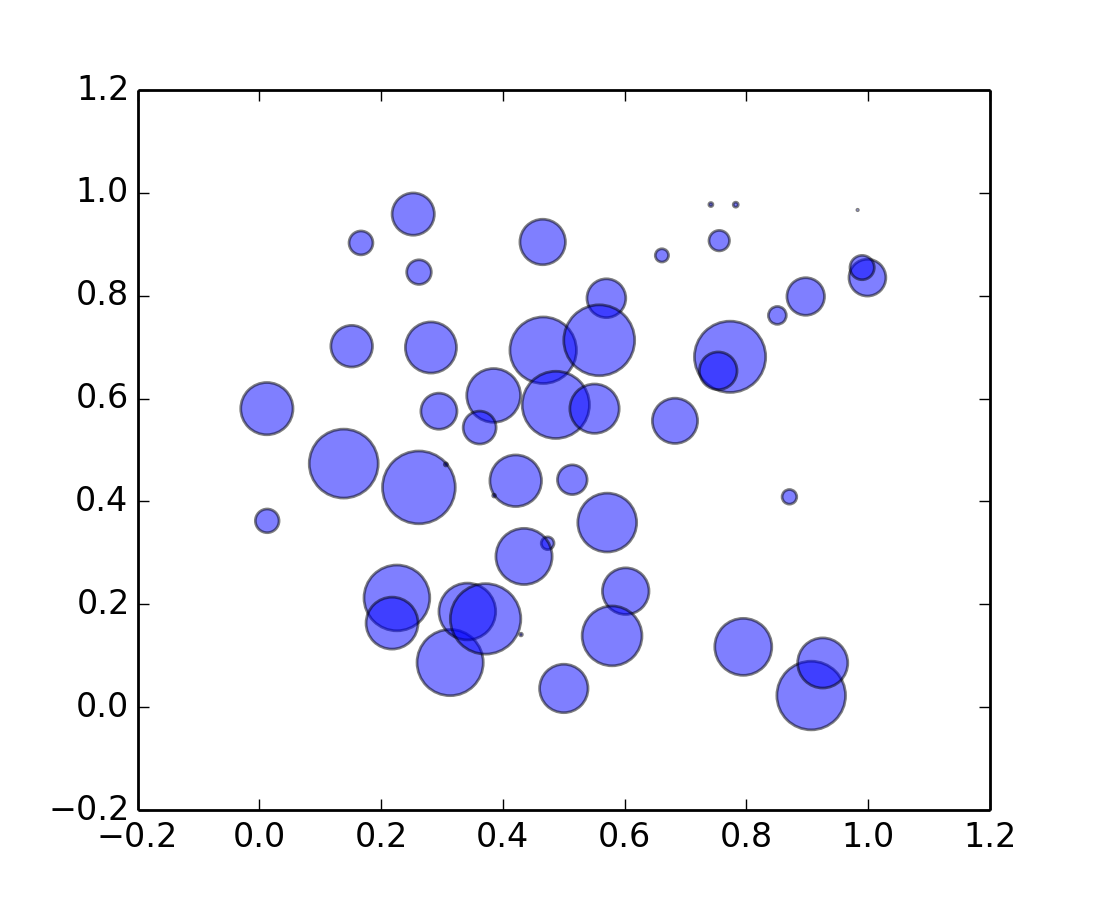
Simple demo of a scatter plot.
"""
import numpy as np
import matplotlib.pyplot as plt
N = 50
x = np.random.rand(N)
y = np.random.rand(N)
area = np.pi * (15 * np.random.rand(N))**2 # 0 to 15 point radiuses
plt.scatter(x, y, s=area, alpha=0.5)
plt.show()
Keywords: python, matplotlib, pylab, example, codex (see Search examples)