
import numpy as np
import matplotlib.pyplot as plt
fig = plt.figure()
x = np.linspace(-np.pi,np.pi,100)
y = 2*np.sin(x)
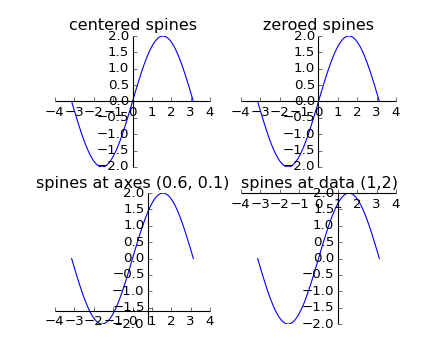
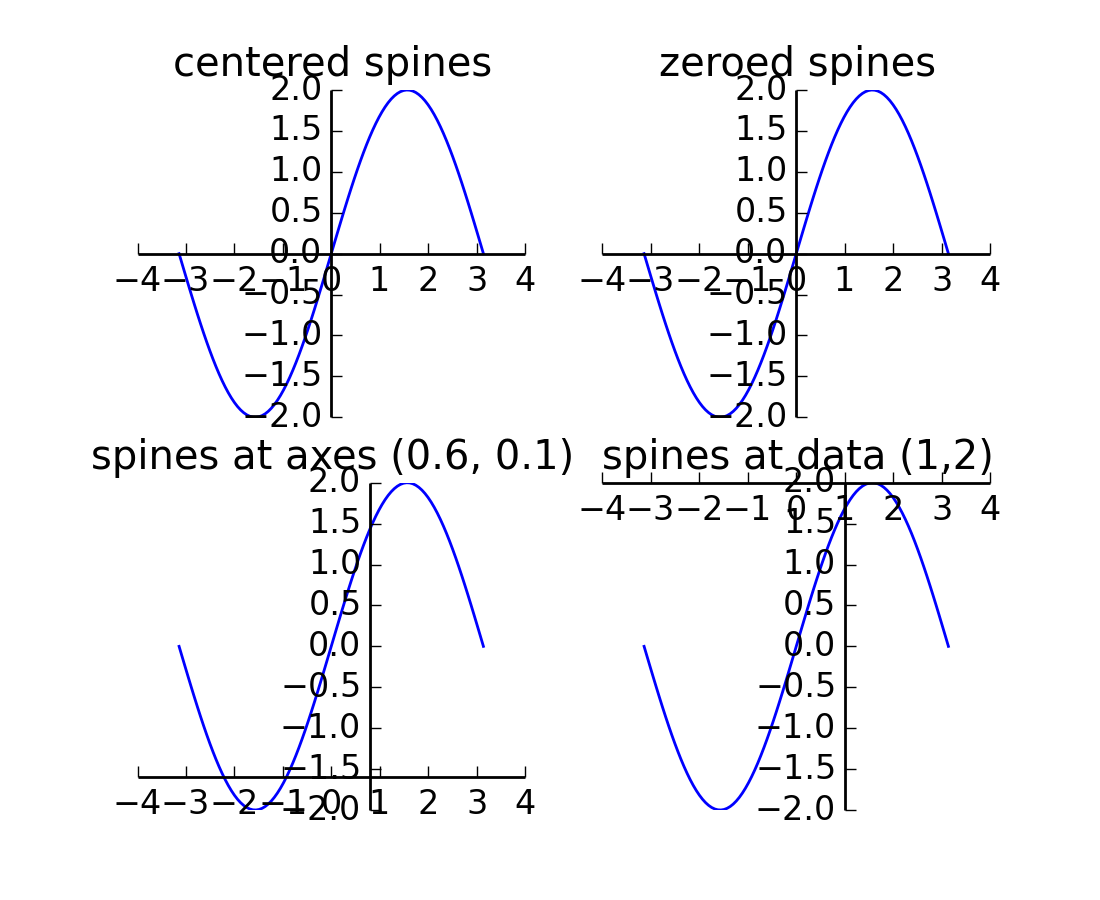
ax = fig.add_subplot(2,2,1)
ax.set_title('centered spines')
ax.plot(x,y)
ax.spines['left'].set_position('center')
ax.spines['right'].set_color('none')
ax.spines['bottom'].set_position('center')
ax.spines['top'].set_color('none')
ax.spines['left'].set_smart_bounds(True)
ax.spines['bottom'].set_smart_bounds(True)
ax.xaxis.set_ticks_position('bottom')
ax.yaxis.set_ticks_position('left')
ax = fig.add_subplot(2,2,2)
ax.set_title('zeroed spines')
ax.plot(x,y)
ax.spines['left'].set_position('zero')
ax.spines['right'].set_color('none')
ax.spines['bottom'].set_position('zero')
ax.spines['top'].set_color('none')
ax.spines['left'].set_smart_bounds(True)
ax.spines['bottom'].set_smart_bounds(True)
ax.xaxis.set_ticks_position('bottom')
ax.yaxis.set_ticks_position('left')
ax = fig.add_subplot(2,2,3)
ax.set_title('spines at axes (0.6, 0.1)')
ax.plot(x,y)
ax.spines['left'].set_position(('axes',0.6))
ax.spines['right'].set_color('none')
ax.spines['bottom'].set_position(('axes',0.1))
ax.spines['top'].set_color('none')
ax.spines['left'].set_smart_bounds(True)
ax.spines['bottom'].set_smart_bounds(True)
ax.xaxis.set_ticks_position('bottom')
ax.yaxis.set_ticks_position('left')
ax = fig.add_subplot(2,2,4)
ax.set_title('spines at data (1,2)')
ax.plot(x,y)
ax.spines['left'].set_position(('data',1))
ax.spines['right'].set_color('none')
ax.spines['bottom'].set_position(('data',2))
ax.spines['top'].set_color('none')
ax.spines['left'].set_smart_bounds(True)
ax.spines['bottom'].set_smart_bounds(True)
ax.xaxis.set_ticks_position('bottom')
ax.yaxis.set_ticks_position('left')
# ----------------------------------------------------
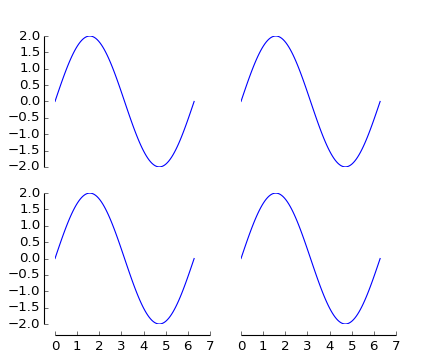
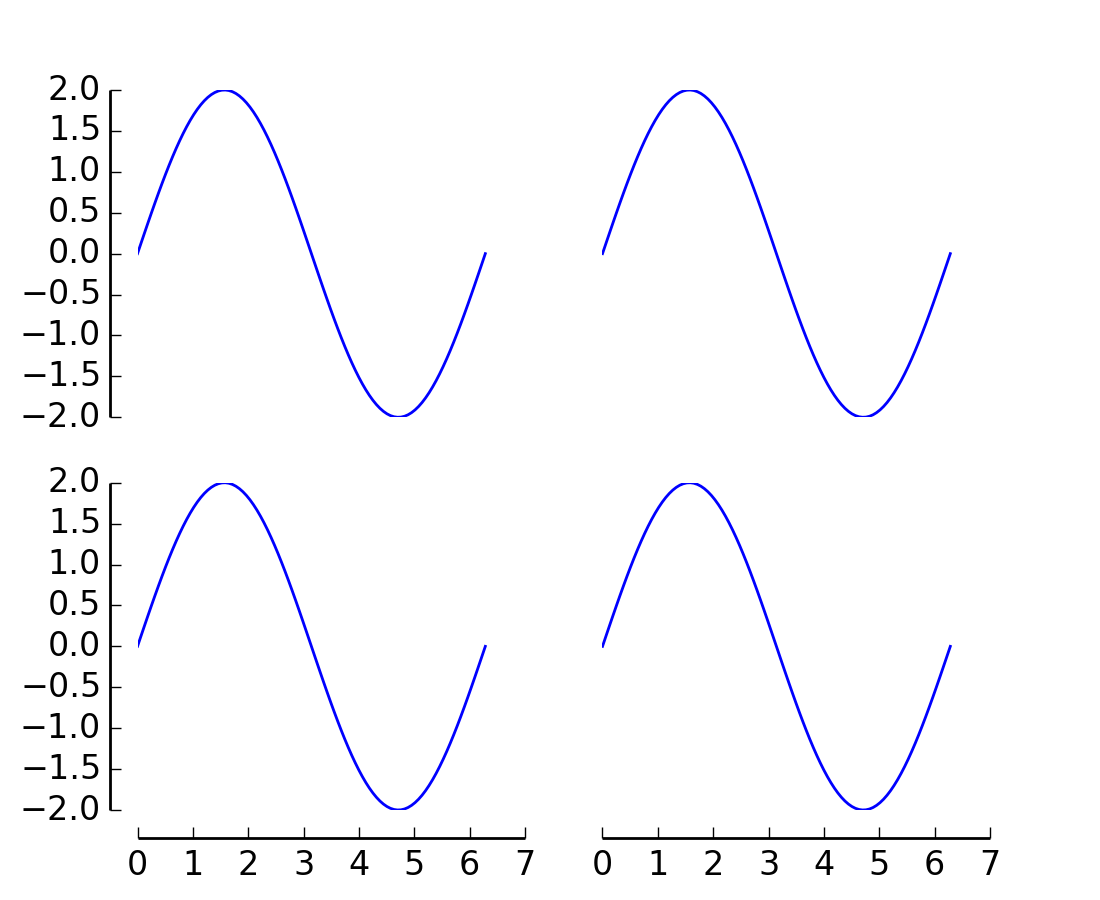
def adjust_spines(ax,spines):
for loc, spine in ax.spines.items():
if loc in spines:
spine.set_position(('outward',10)) # outward by 10 points
spine.set_smart_bounds(True)
else:
spine.set_color('none') # don't draw spine
# turn off ticks where there is no spine
if 'left' in spines:
ax.yaxis.set_ticks_position('left')
else:
# no yaxis ticks
ax.yaxis.set_ticks([])
if 'bottom' in spines:
ax.xaxis.set_ticks_position('bottom')
else:
# no xaxis ticks
ax.xaxis.set_ticks([])
fig = plt.figure()
x = np.linspace(0,2*np.pi,100)
y = 2*np.sin(x)
ax = fig.add_subplot(2,2,1)
ax.plot(x,y)
adjust_spines(ax,['left'])
ax = fig.add_subplot(2,2,2)
ax.plot(x,y)
adjust_spines(ax,[])
ax = fig.add_subplot(2,2,3)
ax.plot(x,y)
adjust_spines(ax,['left','bottom'])
ax = fig.add_subplot(2,2,4)
ax.plot(x,y)
adjust_spines(ax,['bottom'])
plt.show()
Keywords: python, matplotlib, pylab, example, codex (see Search examples)
