
(Source code, png, hires.png, pdf)
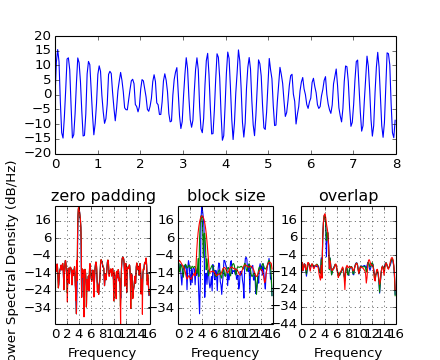
#This example shows the effects of some of the different PSD parameters
import numpy as np
import matplotlib.pyplot as plt

dt = np.pi / 100.
fs = 1. / dt
t = np.arange(0, 8, dt)
y = 10. * np.sin(2 * np.pi * 4 * t) + 5. * np.sin(2 * np.pi * 4.25 * t)
y = y + np.random.randn(*t.shape)

#Plot the raw time series
fig = plt.figure()
fig.subplots_adjust(hspace=0.45, wspace=0.3)
ax = fig.add_subplot(2, 1, 1)
ax.plot(t, y)

#Plot the PSD with different amounts of zero padding. This uses the entire
#time series at once
ax2 = fig.add_subplot(2, 3, 4)
ax2.psd(y, NFFT=len(t), pad_to=len(t), Fs=fs)
ax2.psd(y, NFFT=len(t), pad_to=len(t)*2, Fs=fs)
ax2.psd(y, NFFT=len(t), pad_to=len(t)*4, Fs=fs)
plt.title('zero padding')

#Plot the PSD with different block sizes, Zero pad to the length of the original
#data sequence.
ax3 = fig.add_subplot(2, 3, 5, sharex=ax2, sharey=ax2)
ax3.psd(y, NFFT=len(t), pad_to=len(t), Fs=fs)
ax3.psd(y, NFFT=len(t)//2, pad_to=len(t), Fs=fs)
ax3.psd(y, NFFT=len(t)//4, pad_to=len(t), Fs=fs)
ax3.set_ylabel('')
plt.title('block size')

#Plot the PSD with different amounts of overlap between blocks
ax4 = fig.add_subplot(2, 3, 6, sharex=ax2, sharey=ax2)
ax4.psd(y, NFFT=len(t)//2, pad_to=len(t), noverlap=0, Fs=fs)
ax4.psd(y, NFFT=len(t)//2, pad_to=len(t), noverlap=int(0.05*len(t)/2.), Fs=fs)
ax4.psd(y, NFFT=len(t)//2, pad_to=len(t), noverlap=int(0.2*len(t)/2.), Fs=fs)
ax4.set_ylabel('')
plt.title('overlap')

plt.show()
Keywords: python, matplotlib, pylab, example, codex (see Search examples)