
(Source code, png, hires.png, pdf)
import matplotlib.pyplot as plt
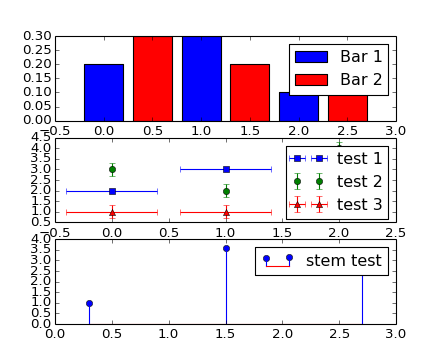
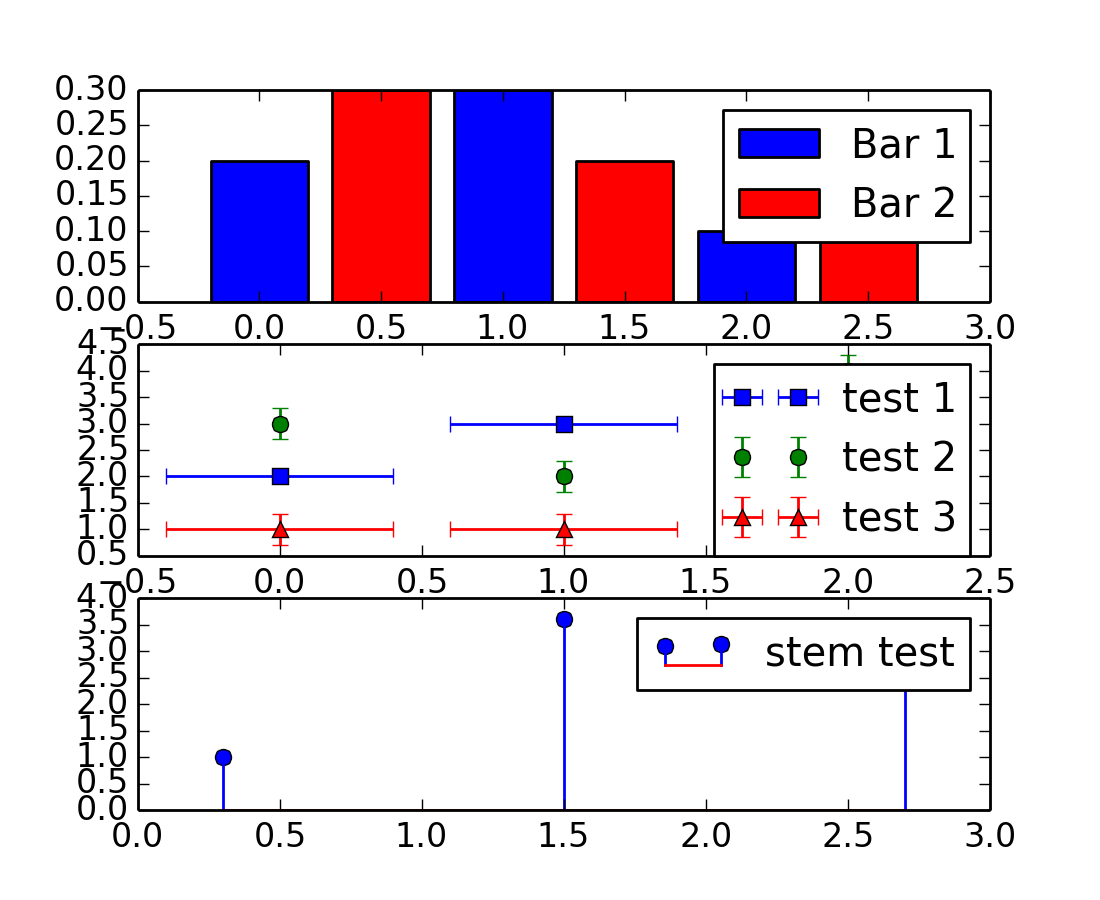
ax = plt.subplot(311)
b1 = ax.bar([0, 1, 2], [0.2, 0.3, 0.1], width=0.4,
label="Bar 1", align="center")
b2 = ax.bar([0.5, 1.5, 2.5], [0.3, 0.2, 0.2], color="red", width=0.4,
label="Bar 2", align="center")
ax.legend()
ax = plt.subplot(312)
err1 = ax.errorbar([0, 1, 2], [2, 3, 1], xerr=0.4, fmt="s",
label="test 1")
err2 = ax.errorbar([0, 1, 2], [3, 2, 4], yerr=0.3, fmt="o",
label="test 2")
err3 = ax.errorbar([0, 1, 2], [1, 1, 3], xerr=0.4, yerr=0.3, fmt="^",
label="test 3")
ax.legend()
ax = plt.subplot(313)
ll = ax.stem([0.3, 1.5, 2.7], [1, 3.6, 2.7], label="stem test")
ax.legend()
plt.show()
Keywords: python, matplotlib, pylab, example, codex (see Search examples)