
"""
This file was written to test matplotlib's autolegend placement
algorithm, but shows lots of different ways to create legends so is
useful as a general examples
Thanks to John Gill and Phil ?? for help at the matplotlib sprint at
pycon 2005 where the auto-legend support was written.
"""
from pylab import *
import sys
rcParams['legend.loc'] = 'best'
N = 100
x = arange(N)
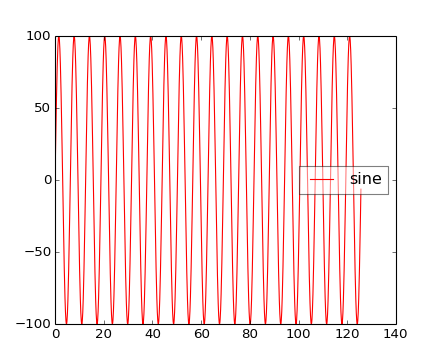
def fig_1():
figure(1)
t = arange(0, 40.0 * pi, 0.1)
l, = plot(t, 100*sin(t), 'r', label='sine')
legend(framealpha=0.5)
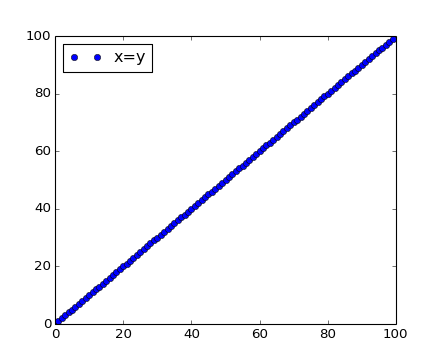
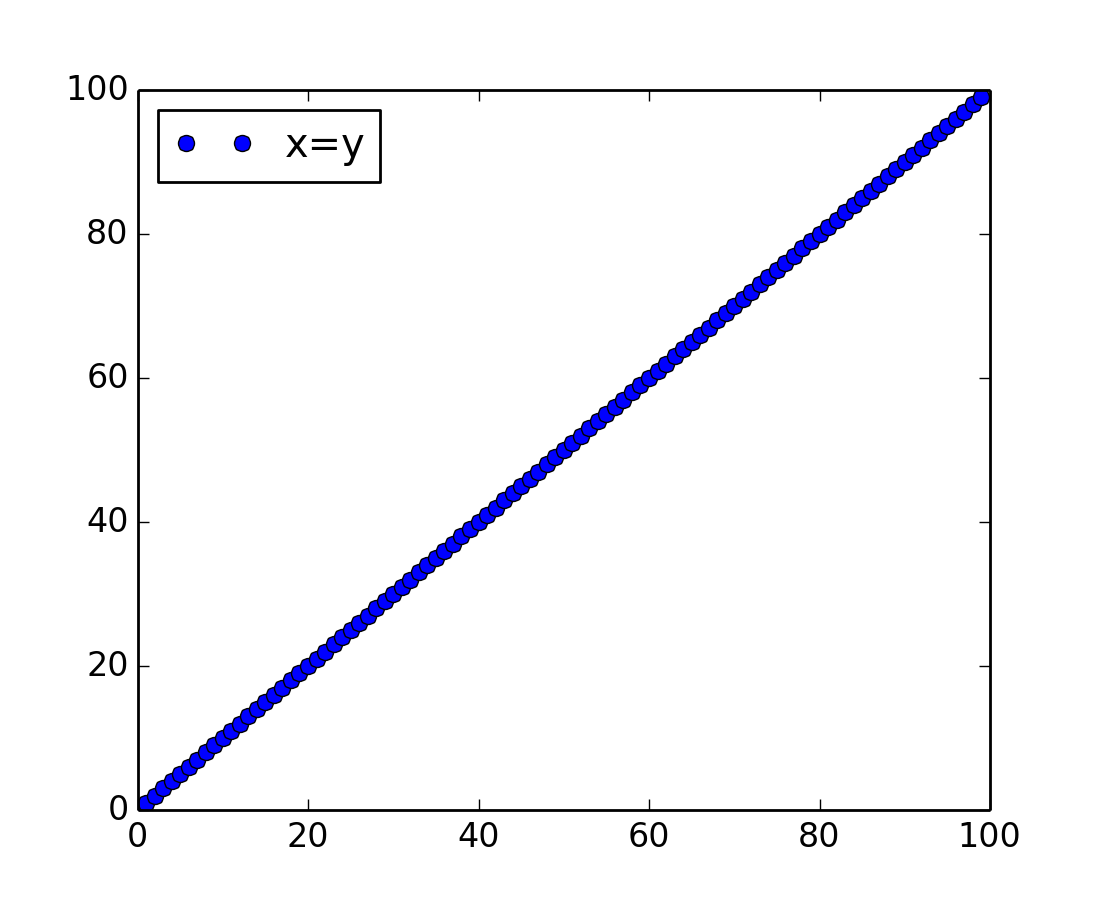
def fig_2():
figure(2)
plot(x, 'o', label='x=y')
legend()
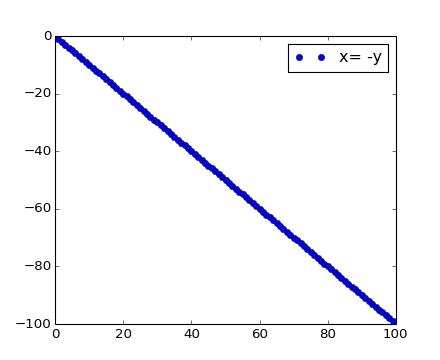
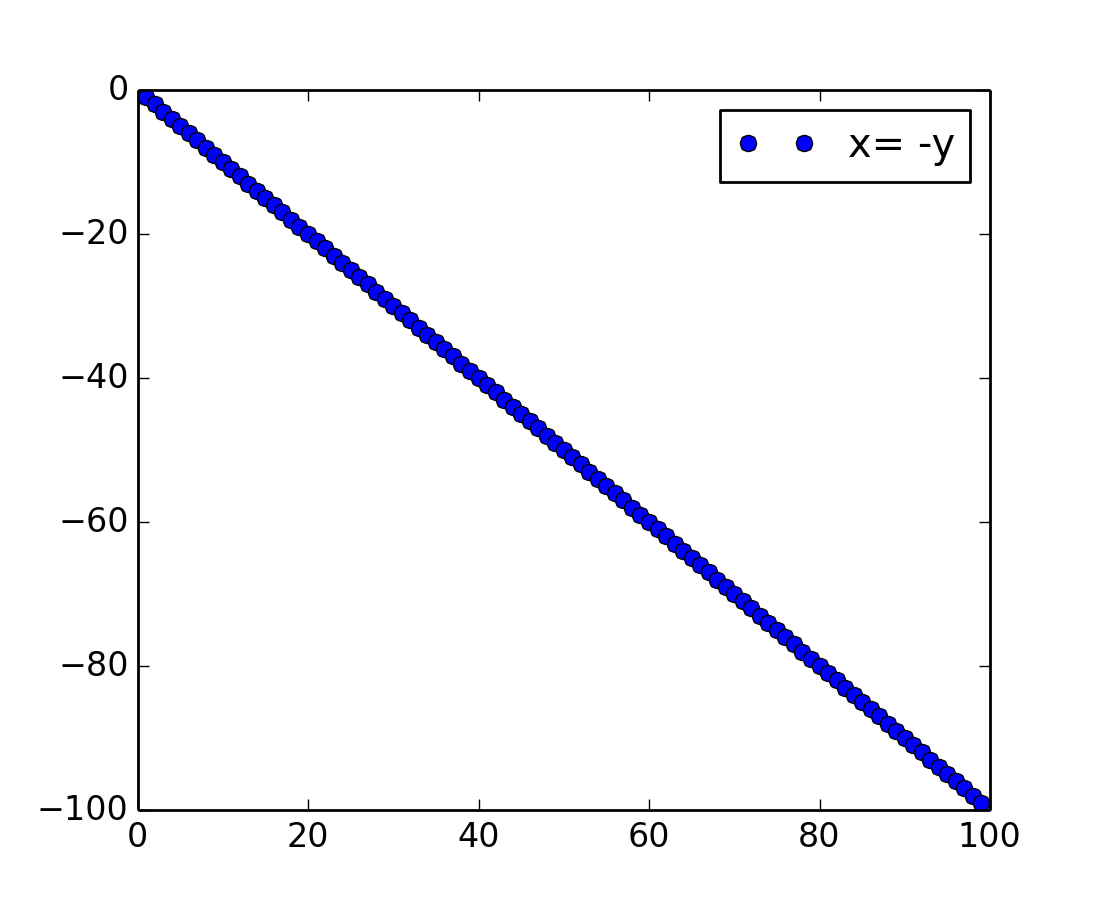
def fig_3():
figure(3)
plot(x, -x, 'o', label='x= -y')
legend()
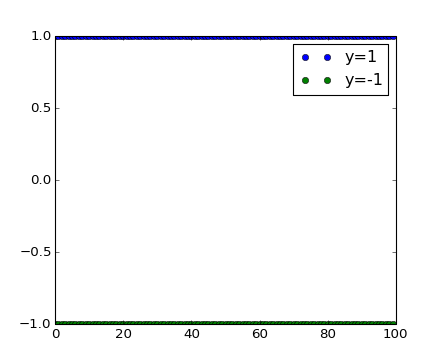
def fig_4():
figure(4)
plot(x, ones(len(x)), 'o', label='y=1')
plot(x, -ones(len(x)), 'o', label='y=-1')
legend()
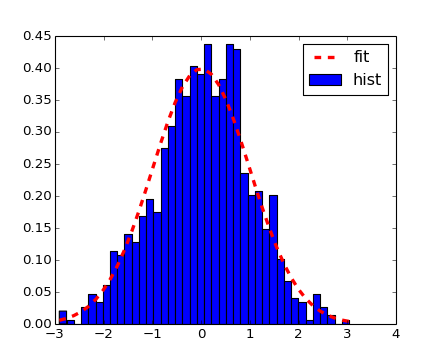
def fig_5():
figure(5)
n, bins, patches = hist(randn(1000), 40, normed=1)
l, = plot(bins, normpdf(bins, 0.0, 1.0), 'r--', label='fit', linewidth=3)
legend([l, patches[0]], ['fit', 'hist'])
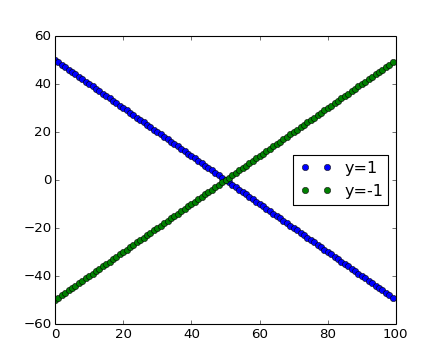
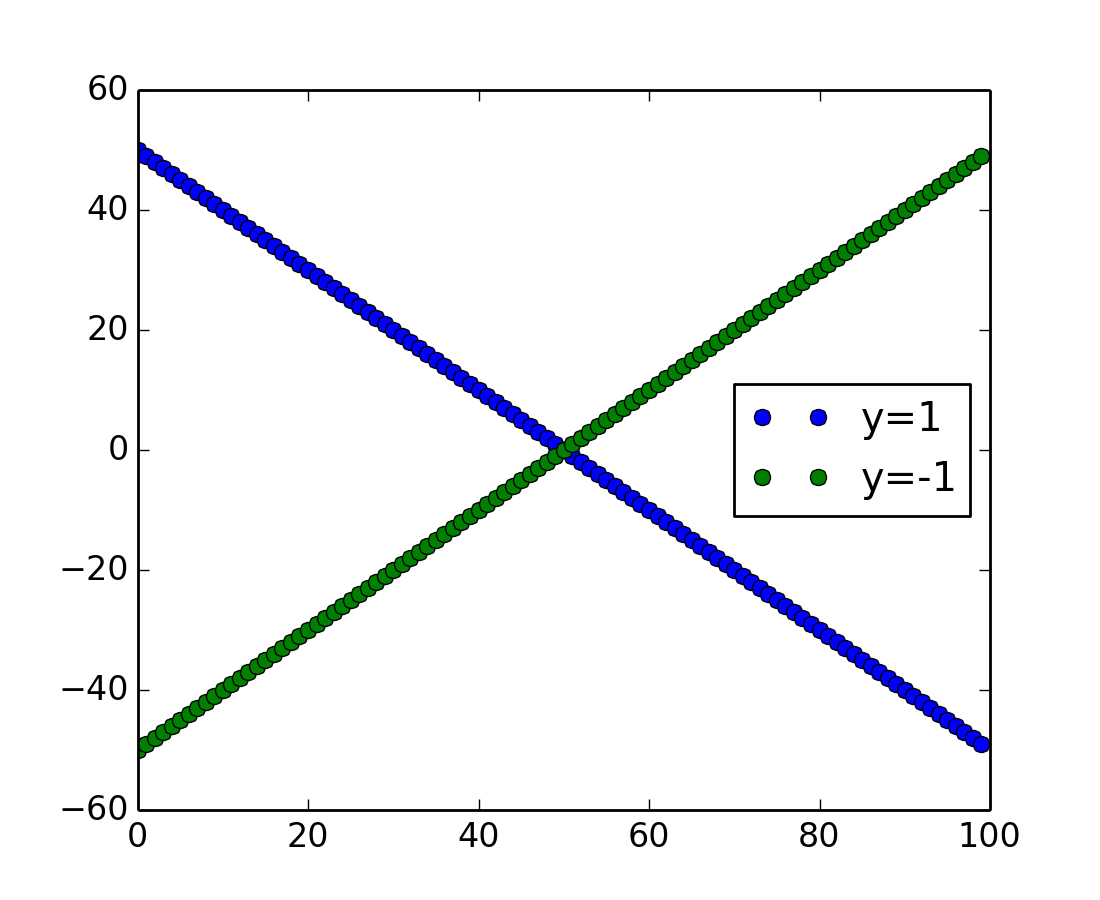
def fig_6():
figure(6)
plot(x, 50-x, 'o', label='y=1')
plot(x, x-50, 'o', label='y=-1')
legend()
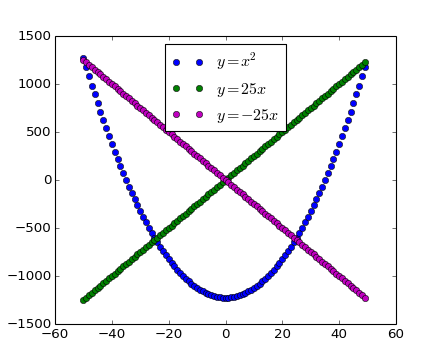
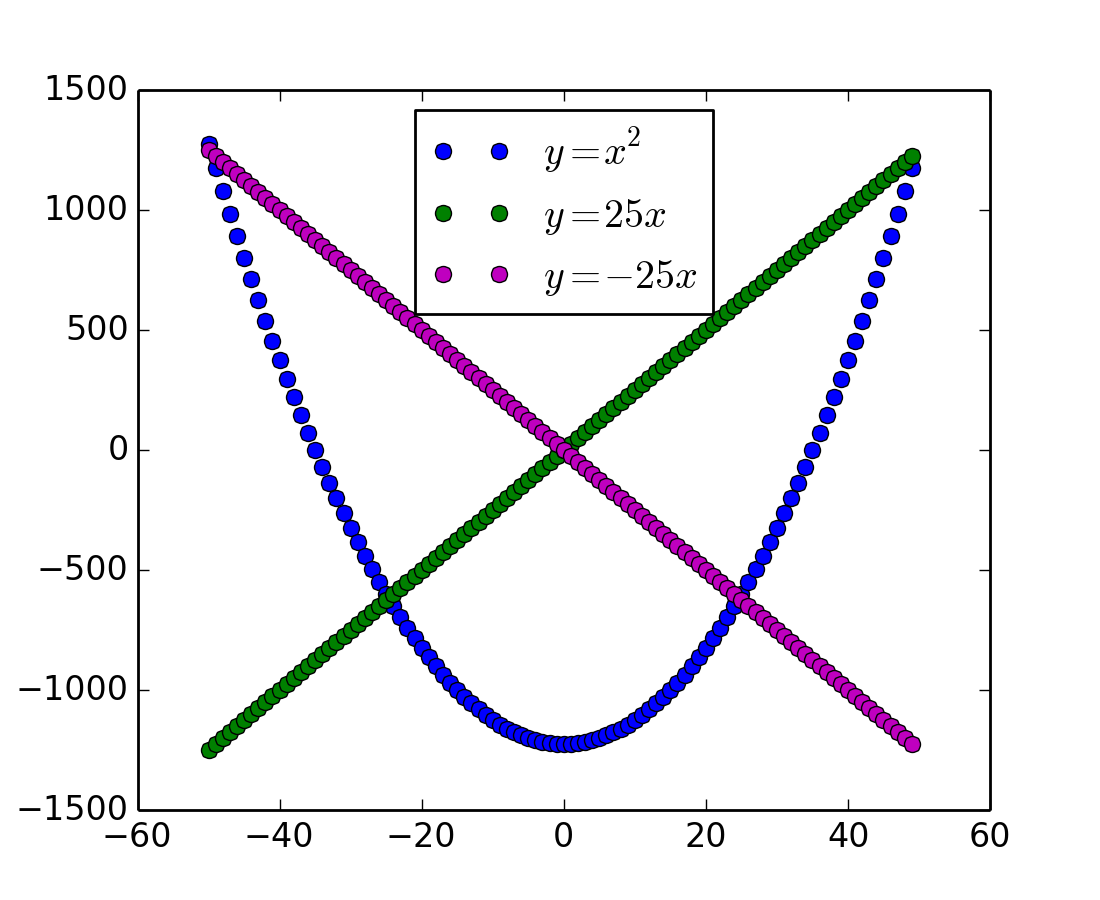
def fig_7():
figure(7)
xx = x - (N/2.0)
plot(xx, (xx*xx)-1225, 'bo', label='$y=x^2$')
plot(xx, 25*xx, 'go', label='$y=25x$')
plot(xx, -25*xx, 'mo', label='$y=-25x$')
legend()
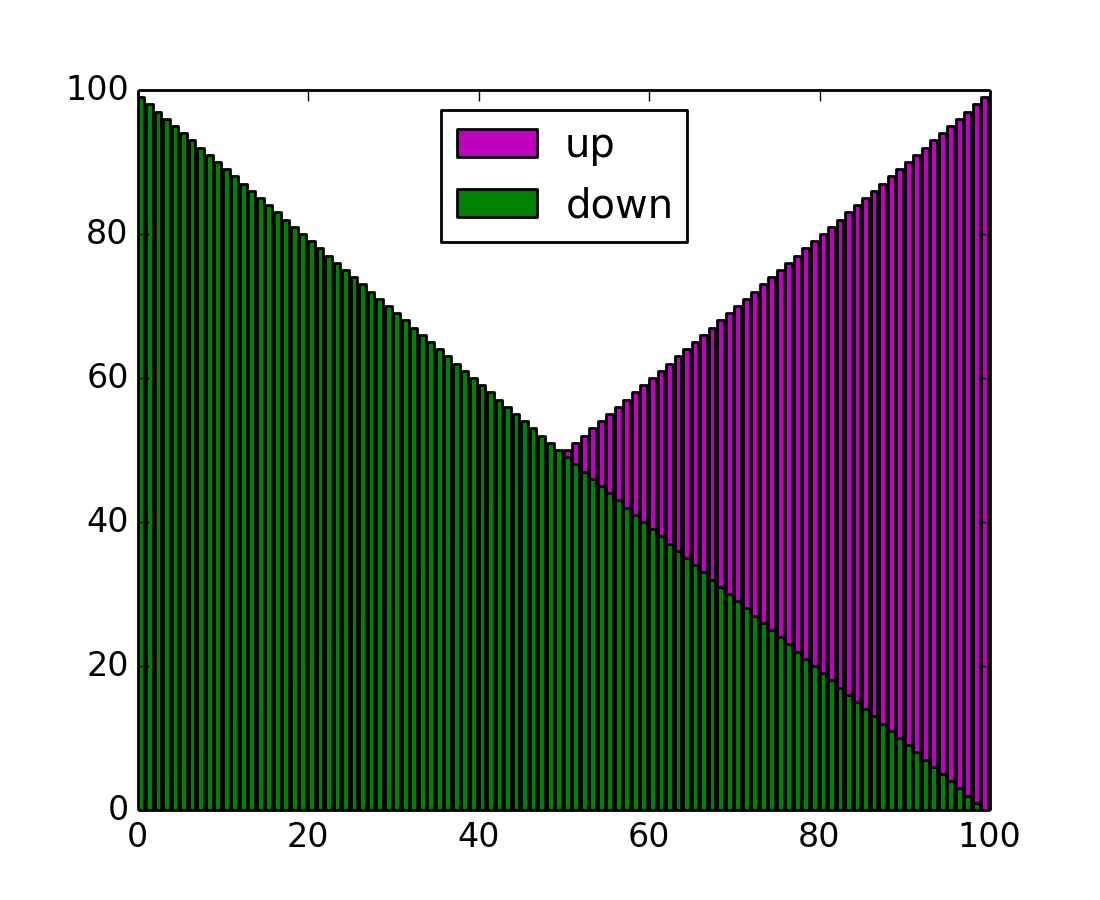
def fig_8():
figure(8)
b1 = bar(x, x, color='m')
b2 = bar(x, x[::-1], color='g')
legend([b1[0], b2[0]], ['up', 'down'])
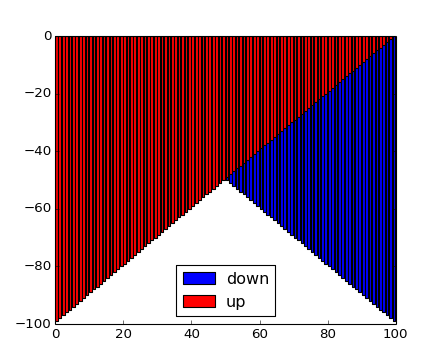
def fig_9():
figure(9)
b1 = bar(x, -x)
b2 = bar(x, -x[::-1], color='r')
legend([b1[0], b2[0]], ['down', 'up'])
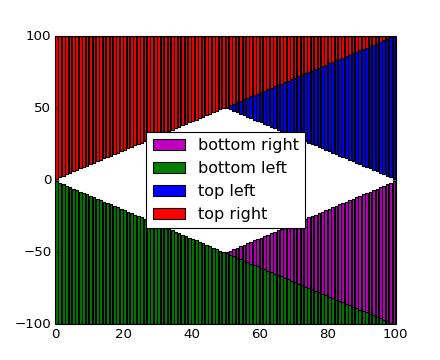
def fig_10():
figure(10)
b1 = bar(x, x, bottom=-100, color='m')
b2 = bar(x, x[::-1], bottom=-100, color='g')
b3 = bar(x, -x, bottom=100)
b4 = bar(x, -x[::-1], bottom=100, color='r')
legend([b1[0], b2[0], b3[0], b4[0]], ['bottom right', 'bottom left',
'top left', 'top right'])
if __name__ == '__main__':
nfigs = 10
figures = []
for f in sys.argv[1:]:
try:
figures.append(int(f))
except ValueError:
pass
if len(figures) == 0:
figures = range(1, nfigs+1)
for fig in figures:
fn_name = "fig_%d" % fig
fn = globals()[fn_name]
fn()
show()
Keywords: python, matplotlib, pylab, example, codex (see Search examples)


