
(Source code, png, hires.png, pdf)
import datetime
import numpy as np
import matplotlib.colors as colors
import matplotlib.finance as finance
import matplotlib.dates as mdates
import matplotlib.ticker as mticker
import matplotlib.mlab as mlab
import matplotlib.pyplot as plt
import matplotlib.font_manager as font_manager
startdate = datetime.date(2006,1,1)
today = enddate = datetime.date.today()
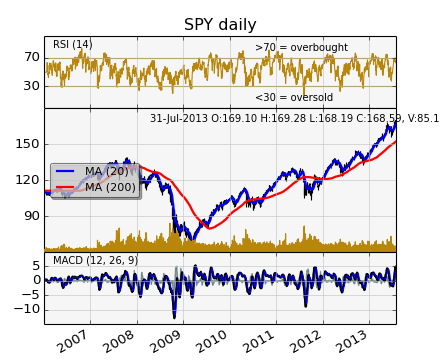
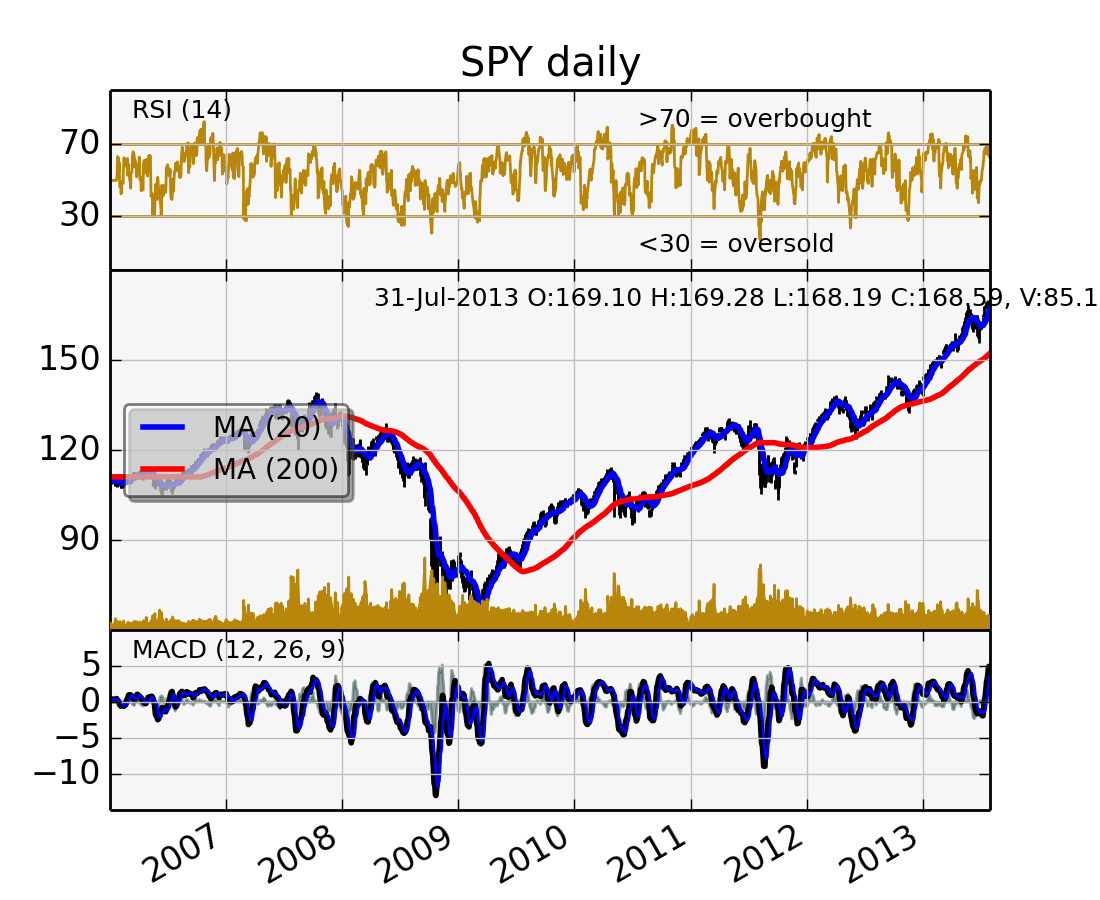
ticker = 'SPY'
fh = finance.fetch_historical_yahoo(ticker, startdate, enddate)
# a numpy record array with fields: date, open, high, low, close, volume, adj_close)
r = mlab.csv2rec(fh); fh.close()
r.sort()
def moving_average(x, n, type='simple'):
"""
compute an n period moving average.
type is 'simple' | 'exponential'
"""
x = np.asarray(x)
if type=='simple':
weights = np.ones(n)
else:
weights = np.exp(np.linspace(-1., 0., n))
weights /= weights.sum()
a = np.convolve(x, weights, mode='full')[:len(x)]
a[:n] = a[n]
return a
def relative_strength(prices, n=14):
"""
compute the n period relative strength indicator
http://stockcharts.com/school/doku.php?id=chart_school:glossary_r#relativestrengthindex
http://www.investopedia.com/terms/r/rsi.asp
"""
deltas = np.diff(prices)
seed = deltas[:n+1]
up = seed[seed>=0].sum()/n
down = -seed[seed<0].sum()/n
rs = up/down
rsi = np.zeros_like(prices)
rsi[:n] = 100. - 100./(1.+rs)
for i in range(n, len(prices)):
delta = deltas[i-1] # cause the diff is 1 shorter
if delta>0:
upval = delta
downval = 0.
else:
upval = 0.
downval = -delta
up = (up*(n-1) + upval)/n
down = (down*(n-1) + downval)/n
rs = up/down
rsi[i] = 100. - 100./(1.+rs)
return rsi
def moving_average_convergence(x, nslow=26, nfast=12):
"""
compute the MACD (Moving Average Convergence/Divergence) using a fast and slow exponential moving avg'
return value is emaslow, emafast, macd which are len(x) arrays
"""
emaslow = moving_average(x, nslow, type='exponential')
emafast = moving_average(x, nfast, type='exponential')
return emaslow, emafast, emafast - emaslow
plt.rc('axes', grid=True)
plt.rc('grid', color='0.75', linestyle='-', linewidth=0.5)
textsize = 9
left, width = 0.1, 0.8
rect1 = [left, 0.7, width, 0.2]
rect2 = [left, 0.3, width, 0.4]
rect3 = [left, 0.1, width, 0.2]
fig = plt.figure(facecolor='white')
axescolor = '#f6f6f6' # the axes background color
ax1 = fig.add_axes(rect1, axisbg=axescolor) #left, bottom, width, height
ax2 = fig.add_axes(rect2, axisbg=axescolor, sharex=ax1)
ax2t = ax2.twinx()
ax3 = fig.add_axes(rect3, axisbg=axescolor, sharex=ax1)
### plot the relative strength indicator
prices = r.adj_close
rsi = relative_strength(prices)
fillcolor = 'darkgoldenrod'
ax1.plot(r.date, rsi, color=fillcolor)
ax1.axhline(70, color=fillcolor)
ax1.axhline(30, color=fillcolor)
ax1.fill_between(r.date, rsi, 70, where=(rsi>=70), facecolor=fillcolor, edgecolor=fillcolor)
ax1.fill_between(r.date, rsi, 30, where=(rsi<=30), facecolor=fillcolor, edgecolor=fillcolor)
ax1.text(0.6, 0.9, '>70 = overbought', va='top', transform=ax1.transAxes, fontsize=textsize)
ax1.text(0.6, 0.1, '<30 = oversold', transform=ax1.transAxes, fontsize=textsize)
ax1.set_ylim(0, 100)
ax1.set_yticks([30,70])
ax1.text(0.025, 0.95, 'RSI (14)', va='top', transform=ax1.transAxes, fontsize=textsize)
ax1.set_title('%s daily'%ticker)
### plot the price and volume data
dx = r.adj_close - r.close
low = r.low + dx
high = r.high + dx
deltas = np.zeros_like(prices)
deltas[1:] = np.diff(prices)
up = deltas>0
ax2.vlines(r.date[up], low[up], high[up], color='black', label='_nolegend_')
ax2.vlines(r.date[~up], low[~up], high[~up], color='black', label='_nolegend_')
ma20 = moving_average(prices, 20, type='simple')
ma200 = moving_average(prices, 200, type='simple')
linema20, = ax2.plot(r.date, ma20, color='blue', lw=2, label='MA (20)')
linema200, = ax2.plot(r.date, ma200, color='red', lw=2, label='MA (200)')
last = r[-1]
s = '%s O:%1.2f H:%1.2f L:%1.2f C:%1.2f, V:%1.1fM Chg:%+1.2f' % (
today.strftime('%d-%b-%Y'),
last.open, last.high,
last.low, last.close,
last.volume*1e-6,
last.close-last.open )
t4 = ax2.text(0.3, 0.9, s, transform=ax2.transAxes, fontsize=textsize)
props = font_manager.FontProperties(size=10)
leg = ax2.legend(loc='center left', shadow=True, fancybox=True, prop=props)
leg.get_frame().set_alpha(0.5)
volume = (r.close*r.volume)/1e6 # dollar volume in millions
vmax = volume.max()
poly = ax2t.fill_between(r.date, volume, 0, label='Volume', facecolor=fillcolor, edgecolor=fillcolor)
ax2t.set_ylim(0, 5*vmax)
ax2t.set_yticks([])
### compute the MACD indicator
fillcolor = 'darkslategrey'
nslow = 26
nfast = 12
nema = 9
emaslow, emafast, macd = moving_average_convergence(prices, nslow=nslow, nfast=nfast)
ema9 = moving_average(macd, nema, type='exponential')
ax3.plot(r.date, macd, color='black', lw=2)
ax3.plot(r.date, ema9, color='blue', lw=1)
ax3.fill_between(r.date, macd-ema9, 0, alpha=0.5, facecolor=fillcolor, edgecolor=fillcolor)
ax3.text(0.025, 0.95, 'MACD (%d, %d, %d)'%(nfast, nslow, nema), va='top',
transform=ax3.transAxes, fontsize=textsize)
#ax3.set_yticks([])
# turn off upper axis tick labels, rotate the lower ones, etc
for ax in ax1, ax2, ax2t, ax3:
if ax!=ax3:
for label in ax.get_xticklabels():
label.set_visible(False)
else:
for label in ax.get_xticklabels():
label.set_rotation(30)
label.set_horizontalalignment('right')
ax.fmt_xdata = mdates.DateFormatter('%Y-%m-%d')
class MyLocator(mticker.MaxNLocator):
def __init__(self, *args, **kwargs):
mticker.MaxNLocator.__init__(self, *args, **kwargs)
def __call__(self, *args, **kwargs):
return mticker.MaxNLocator.__call__(self, *args, **kwargs)
# at most 5 ticks, pruning the upper and lower so they don't overlap
# with other ticks
#ax2.yaxis.set_major_locator(mticker.MaxNLocator(5, prune='both'))
#ax3.yaxis.set_major_locator(mticker.MaxNLocator(5, prune='both'))
ax2.yaxis.set_major_locator(MyLocator(5, prune='both'))
ax3.yaxis.set_major_locator(MyLocator(5, prune='both'))
plt.show()
Keywords: python, matplotlib, pylab, example, codex (see Search examples)