
(Source code, png, hires.png, pdf)
#!/usr/bin/env python
import matplotlib.pyplot as plt
from matplotlib.dates import DateFormatter, WeekdayLocator, HourLocator, \
DayLocator, MONDAY
from matplotlib.finance import quotes_historical_yahoo, candlestick,\
plot_day_summary, candlestick2
# (Year, month, day) tuples suffice as args for quotes_historical_yahoo
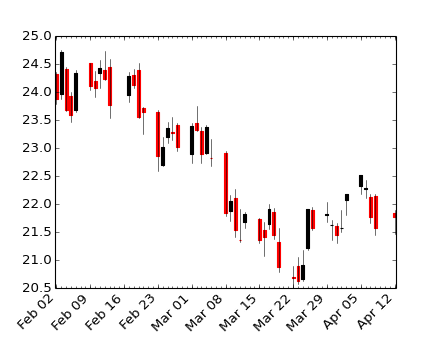
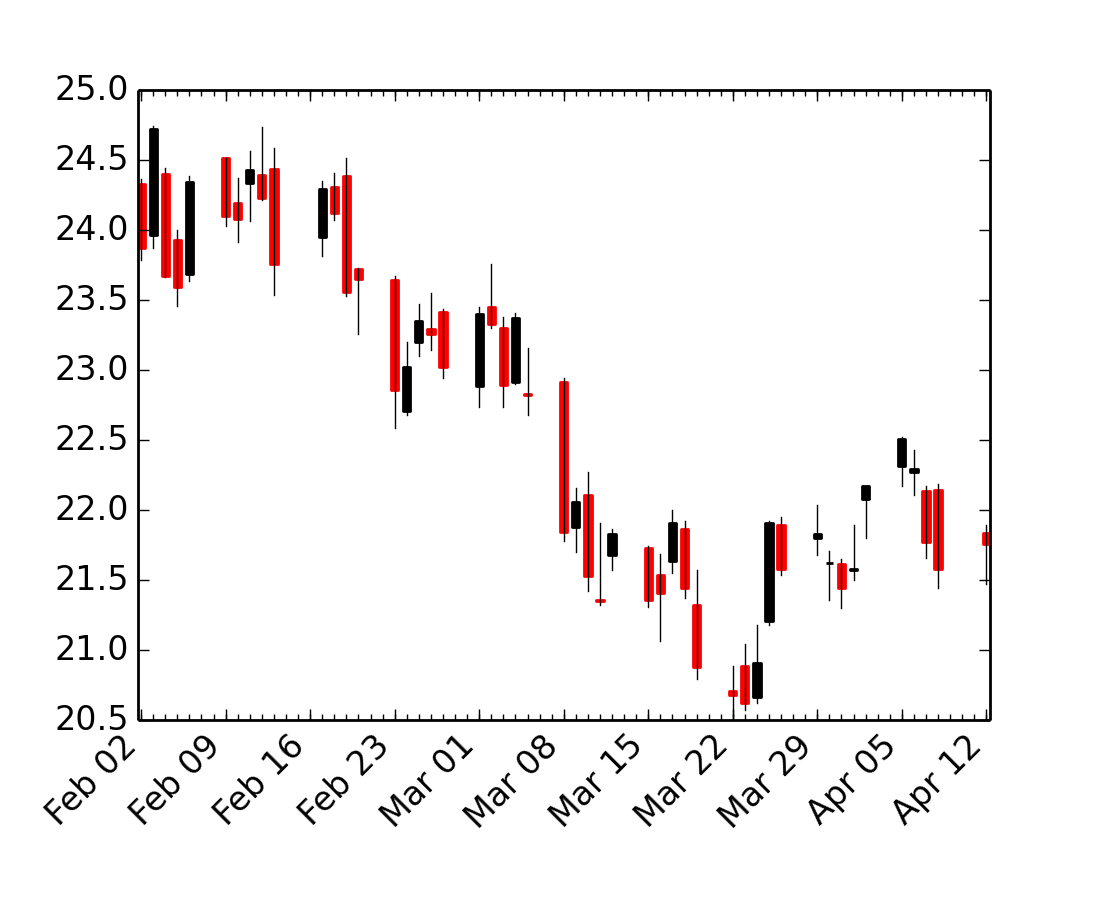
date1 = ( 2004, 2, 1)
date2 = ( 2004, 4, 12 )
mondays = WeekdayLocator(MONDAY) # major ticks on the mondays
alldays = DayLocator() # minor ticks on the days
weekFormatter = DateFormatter('%b %d') # e.g., Jan 12
dayFormatter = DateFormatter('%d') # e.g., 12
quotes = quotes_historical_yahoo('INTC', date1, date2)
if len(quotes) == 0:
raise SystemExit
fig, ax = plt.subplots()
fig.subplots_adjust(bottom=0.2)
ax.xaxis.set_major_locator(mondays)
ax.xaxis.set_minor_locator(alldays)
ax.xaxis.set_major_formatter(weekFormatter)
#ax.xaxis.set_minor_formatter(dayFormatter)
#plot_day_summary(ax, quotes, ticksize=3)
candlestick(ax, quotes, width=0.6)
ax.xaxis_date()
ax.autoscale_view()
plt.setp( plt.gca().get_xticklabels(), rotation=45, horizontalalignment='right')
plt.show()
Keywords: python, matplotlib, pylab, example, codex (see Search examples)