
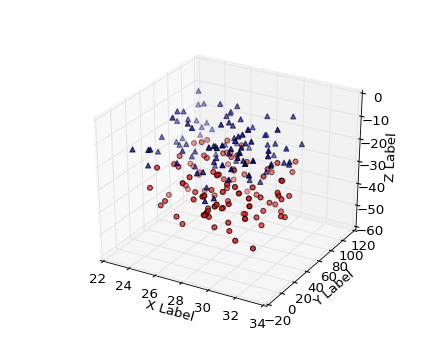
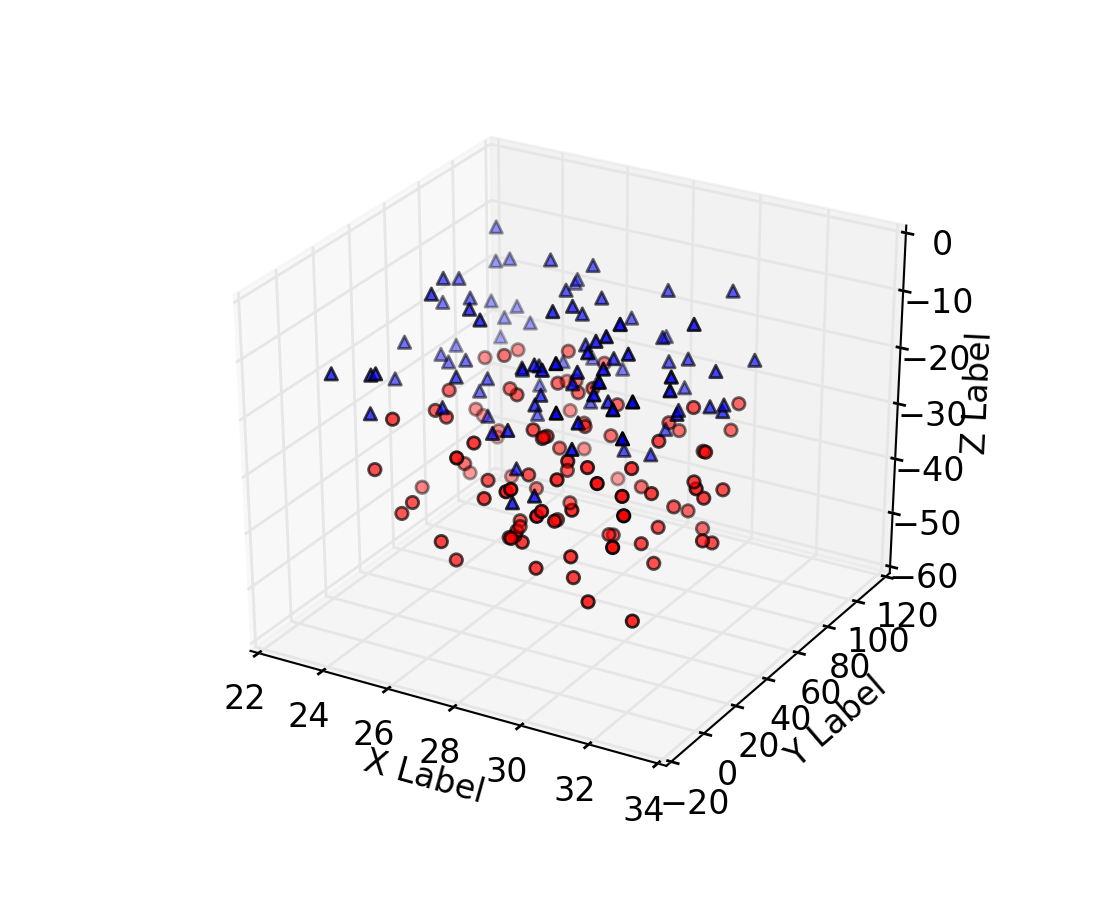
(Source code, png, hires.png, pdf)
import numpy as np
from mpl_toolkits.mplot3d import Axes3D
import matplotlib.pyplot as plt

def randrange(n, vmin, vmax):
    return (vmax-vmin)*np.random.rand(n) + vmin

fig = plt.figure()
ax = fig.add_subplot(111, projection='3d')
n = 100
for c, m, zl, zh in [('r', 'o', -50, -25), ('b', '^', -30, -5)]:
    xs = randrange(n, 23, 32)
    ys = randrange(n, 0, 100)
    zs = randrange(n, zl, zh)
    ax.scatter(xs, ys, zs, c=c, marker=m)

ax.set_xlabel('X Label')
ax.set_ylabel('Y Label')
ax.set_zlabel('Z Label')

plt.show()
Keywords: python, matplotlib, pylab, example, codex (see Search examples)