
(Source code, png, hires.png, pdf)

"""
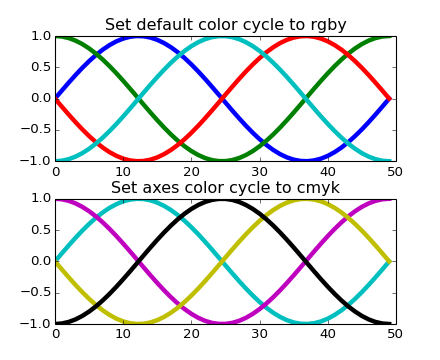
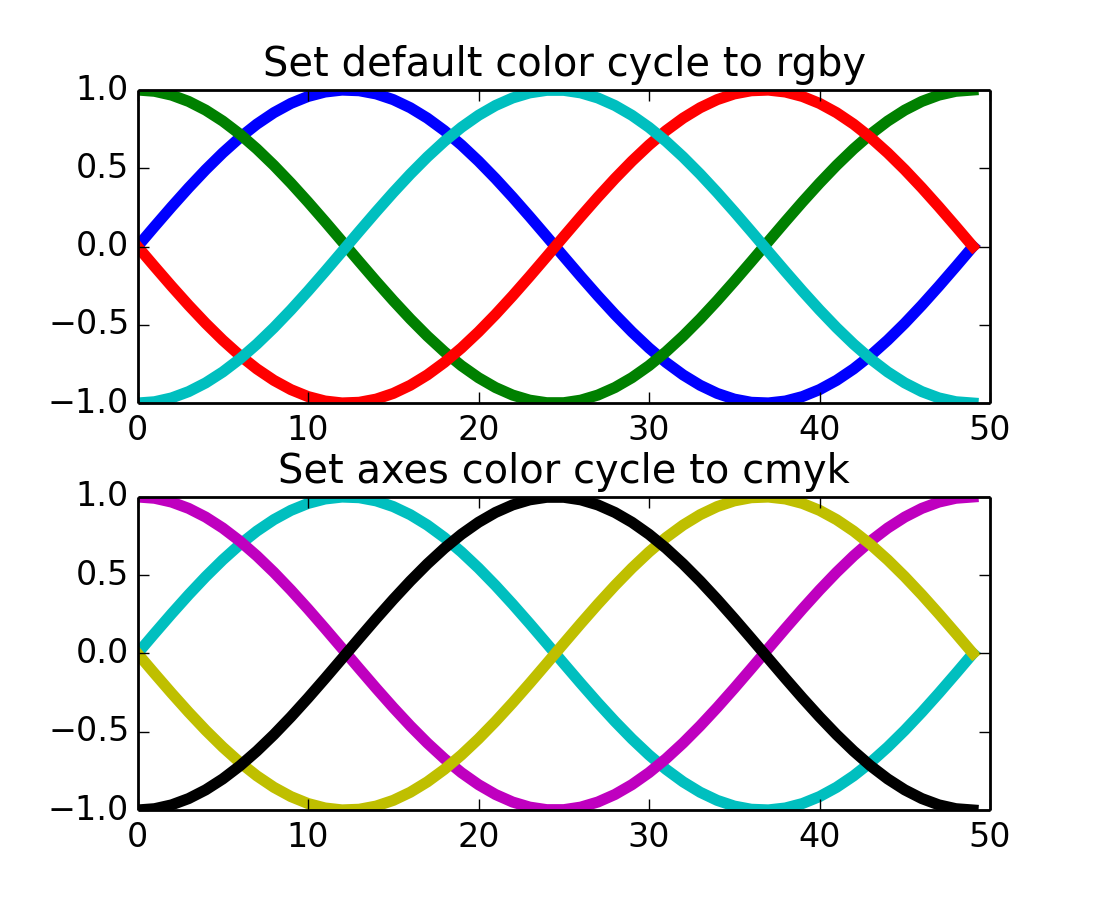
Demo of custom color-cycle settings to control colors for multi-line plots.
This example demonstrates two different APIs:
1. Setting the default rc-parameter specifying the color cycle.
This affects all subsequent plots.
2. Setting the color cycle for a specific axes. This only affects a single
axes.
"""
import numpy as np
import matplotlib.pyplot as plt
x = np.linspace(0, 2 * np.pi)
offsets = np.linspace(0, 2*np.pi, 4, endpoint=False)
# Create array with shifted-sine curve along each column
yy = np.transpose([np.sin(x + phi) for phi in offsets])
plt.rc('lines', linewidth=4)
fig, (ax0, ax1) = plt.subplots(nrows=2)
plt.rc('axes', color_cycle=['r', 'g', 'b', 'y'])
ax0.plot(yy)
ax0.set_title('Set default color cycle to rgby')
ax1.set_color_cycle(['c', 'm', 'y', 'k'])
ax1.plot(yy)
ax1.set_title('Set axes color cycle to cmyk')
# Tweak spacing between subplots to prevent labels from overlapping
plt.subplots_adjust(hspace=0.3)
plt.show()
Keywords: python, matplotlib, pylab, example, codex (see Search examples)