
(Source code, png, hires.png, pdf)
"""
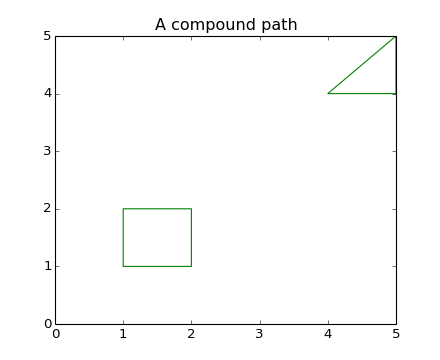
Make a compund path -- in this case two simple polygons, a rectangle
and a triangle. Use CLOSEOPOLY and MOVETO for the different parts of
the compound path
"""
import numpy as np
from matplotlib.path import Path
from matplotlib.patches import PathPatch
import matplotlib.pyplot as plt
vertices = []
codes = []
codes = [Path.MOVETO] + [Path.LINETO]*3 + [Path.CLOSEPOLY]
vertices = [(1,1), (1,2), (2, 2), (2, 1), (0,0)]
codes += [Path.MOVETO] + [Path.LINETO]*2 + [Path.CLOSEPOLY]
vertices += [(4,4), (5,5), (5, 4), (0,0)]
vertices = np.array(vertices, float)
path = Path(vertices, codes)
pathpatch = PathPatch(path, facecolor='None', edgecolor='green')
fig, ax = plt.subplots()
ax.add_patch(pathpatch)
ax.set_title('A compound path')
ax.dataLim.update_from_data_xy(vertices)
ax.autoscale_view()
plt.show()
Keywords: python, matplotlib, pylab, example, codex (see Search examples)