
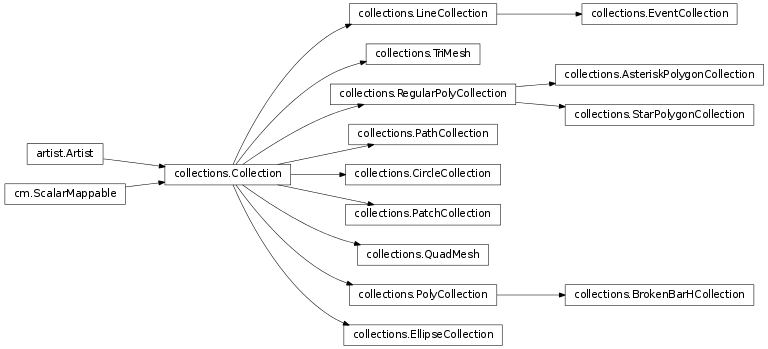
Classes for the efficient drawing of large collections of objects that share most properties, e.g., a large number of line segments or polygons.
The classes are not meant to be as flexible as their single element counterparts (e.g., you may not be able to select all line styles) but they are meant to be fast for common use cases (e.g., a large set of solid line segemnts)
Bases: matplotlib.collections.RegularPolyCollection
Draw a collection of regular asterisks with numsides points.
gives the area of the circle circumscribing the regular polygon in points^2
Valid Collection keyword arguments:
- edgecolors: None
- facecolors: None
- linewidths: None
- antialiaseds: None
- offsets: None
- transOffset: transforms.IdentityTransform()
- norm: None (optional for matplotlib.cm.ScalarMappable)
- cmap: None (optional for matplotlib.cm.ScalarMappable)
offsets and transOffset are used to translate the patch after rendering (default no offsets)
If any of edgecolors, facecolors, linewidths, antialiaseds are None, they default to their matplotlib.rcParams patch setting, in sequence form.
Example: see examples/dynamic_collection.py for complete example:
offsets = np.random.rand(20,2)
facecolors = [cm.jet(x) for x in np.random.rand(20)]
black = (0,0,0,1)

collection = RegularPolyCollection(
    numsides=5, # a pentagon
    rotation=0, sizes=(50,),
    facecolors = facecolors,
    edgecolors = (black,),
    linewidths = (1,),
    offsets = offsets,
    transOffset = ax.transData,
    )
Bases: matplotlib.collections.PolyCollection
A collection of horizontal bars spanning yrange with a sequence of xranges.
ymin, ywidth
Valid Collection keyword arguments:
- edgecolors: None
- facecolors: None
- linewidths: None
- antialiaseds: None
- offsets: None
- transOffset: transforms.IdentityTransform()
- norm: None (optional for matplotlib.cm.ScalarMappable)
- cmap: None (optional for matplotlib.cm.ScalarMappable)
offsets and transOffset are used to translate the patch after rendering (default no offsets)
If any of edgecolors, facecolors, linewidths, antialiaseds are None, they default to their matplotlib.rcParams patch setting, in sequence form.
Create a BrokenBarHCollection to plot horizontal bars from over the regions in x where where is True. The bars range on the y-axis from ymin to ymax
A BrokenBarHCollection is returned. kwargs are passed on to the collection.
Bases: matplotlib.collections.Collection
A collection of circles, drawn using splines.
sizes Gives the area of the circle in points^2
Valid Collection keyword arguments:
- edgecolors: None
- facecolors: None
- linewidths: None
- antialiaseds: None
- offsets: None
- transOffset: transforms.IdentityTransform()
- norm: None (optional for matplotlib.cm.ScalarMappable)
- cmap: None (optional for matplotlib.cm.ScalarMappable)
offsets and transOffset are used to translate the patch after rendering (default no offsets)
If any of edgecolors, facecolors, linewidths, antialiaseds are None, they default to their matplotlib.rcParams patch setting, in sequence form.
return sizes of circles
Bases: matplotlib.artist.Artist, matplotlib.cm.ScalarMappable
Base class for Collections. Must be subclassed to be usable.
All properties in a collection must be sequences or scalars; if scalars, they will be converted to sequences. The property of the ith element of the collection is:
prop[i % len(props)]
Keyword arguments and default values:
- edgecolors: None
- facecolors: None
- linewidths: None
- antialiaseds: None
- offsets: None
- transOffset: transforms.IdentityTransform()
- offset_position: ‘screen’ (default) or ‘data’
- norm: None (optional for matplotlib.cm.ScalarMappable)
- cmap: None (optional for matplotlib.cm.ScalarMappable)
- hatch: None
- zorder: 1
offsets and transOffset are used to translate the patch after rendering (default no offsets). If offset_position is ‘screen’ (default) the offset is applied after the master transform has been applied, that is, the offsets are in screen coordinates. If offset_position is ‘data’, the offset is applied before the master transform, i.e., the offsets are in data coordinates.
If any of edgecolors, facecolors, linewidths, antialiaseds are None, they default to their matplotlib.rcParams patch setting, in sequence form.
The use of ScalarMappable is optional. If the ScalarMappable matrix _A is not None (ie a call to set_array has been made), at draw time a call to scalar mappable will be made to set the face colors.
Create a Collection
%(Collection)s
Test whether the mouse event occurred in the collection.
Returns True | False, dict(ind=itemlist), where every item in itemlist contains the event.
Return the current hatching pattern
Returns how offsets are applied for the collection. If offset_position is ‘screen’, the offset is applied after the master transform has been applied, that is, the offsets are in screen coordinates. If offset_position is ‘data’, the offset is applied before the master transform, i.e., the offsets are in data coordinates.
Return the offsets for the collection.
Set the alpha tranparencies of the collection. alpha must be a float or None.
ACCEPTS: float or None
Set the antialiasing state for rendering.
ACCEPTS: Boolean or sequence of booleans
alias for set_antialiased
Set both the edgecolor and the facecolor.
ACCEPTS: matplotlib color arg or sequence of rgba tuples
See also
alias for set_linestyle
Set the edgecolor(s) of the collection. c can be a matplotlib color arg (all patches have same color), or a sequence of rgba tuples; if it is a sequence the patches will cycle through the sequence.
If c is ‘face’, the edge color will always be the same as the face color. If it is ‘none’, the patch boundary will not be drawn.
ACCEPTS: matplotlib color arg or sequence of rgba tuples
alias for set_edgecolor
Set the facecolor(s) of the collection. c can be a matplotlib color arg (all patches have same color), or a sequence of rgba tuples; if it is a sequence the patches will cycle through the sequence.
If c is ‘none’, the patch will not be filled.
ACCEPTS: matplotlib color arg or sequence of rgba tuples
alias for set_facecolor
Set the hatching pattern
hatch can be one of:
/   - diagonal hatching
\   - back diagonal
|   - vertical
-   - horizontal
+   - crossed
x   - crossed diagonal
o   - small circle
O   - large circle
.   - dots
*   - stars
Letters can be combined, in which case all the specified hatchings are done. If same letter repeats, it increases the density of hatching of that pattern.
Hatching is supported in the PostScript, PDF, SVG and Agg backends only.
Unlike other properties such as linewidth and colors, hatching can only be specified for the collection as a whole, not separately for each member.
ACCEPTS: [ ‘/’ | ‘\’ | ‘|’ | ‘-‘ | ‘+’ | ‘x’ | ‘o’ | ‘O’ | ‘.’ | ‘*’ ]
Set the linestyle(s) for the collection.
ACCEPTS: [‘solid’ | ‘dashed’, ‘dashdot’, ‘dotted’ | (offset, on-off-dash-seq) ]
alias for set_linestyle
Set the linewidth(s) for the collection. lw can be a scalar or a sequence; if it is a sequence the patches will cycle through the sequence
ACCEPTS: float or sequence of floats
alias for set_linewidth
alias for set_linewidth
Set how offsets are applied. If offset_position is ‘screen’ (default) the offset is applied after the master transform has been applied, that is, the offsets are in screen coordinates. If offset_position is ‘data’, the offset is applied before the master transform, i.e., the offsets are in data coordinates.
Set the offsets for the collection. offsets can be a scalar or a sequence.
ACCEPTS: float or sequence of floats
copy properties from other to self
If the scalar mappable array is not none, update colors from scalar data
Bases: matplotlib.collections.Collection
A collection of ellipses, drawn using splines.
units: [‘points’ | ‘inches’ | ‘dots’ | ‘width’ | ‘height’ | ‘x’ | ‘y’ | ‘xy’]
units in which majors and minors are given; ‘width’ and ‘height’ refer to the dimensions of the axes, while ‘x’ and ‘y’ refer to the offsets data units. ‘xy’ differs from all others in that the angle as plotted varies with the aspect ratio, and equals the specified angle only when the aspect ratio is unity. Hence it behaves the same as the Ellipse with axes.transData as its transform.
Additional kwargs inherited from the base Collection:
Valid Collection keyword arguments:
- edgecolors: None
- facecolors: None
- linewidths: None
- antialiaseds: None
- offsets: None
- transOffset: transforms.IdentityTransform()
- norm: None (optional for matplotlib.cm.ScalarMappable)
- cmap: None (optional for matplotlib.cm.ScalarMappable)
offsets and transOffset are used to translate the patch after rendering (default no offsets)
If any of edgecolors, facecolors, linewidths, antialiaseds are None, they default to their matplotlib.rcParams patch setting, in sequence form.
Bases: matplotlib.collections.LineCollection
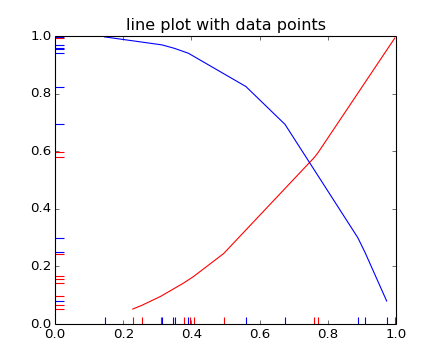
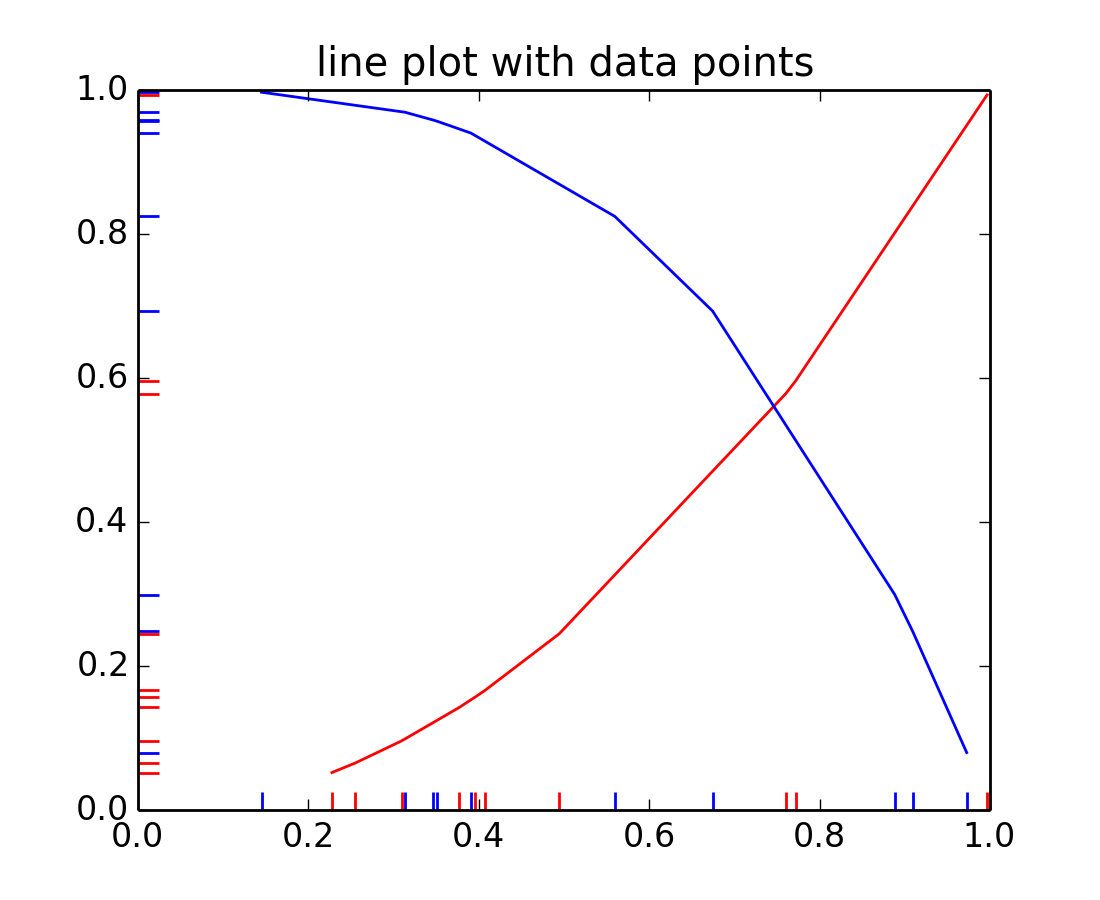
A collection of discrete events.
An event is a 1-dimensional value, usually the position of something along an axis, such as time or length. Events do not have an amplitude. They are displayed as v
linestyle [ ‘solid’ | ‘dashed’ | ‘dashdot’ | ‘dotted’ ]
If linewidth, color, or antialiased is None, they default to their rcParams setting, in sequence form.
pickradius is the tolerance for mouse clicks picking a line. The default is 5 pt.
The use of ScalarMappable is optional. If the ScalarMappable array _A is not None (ie a call to set_array() has been made), at draw time a call to scalar mappable will be made to set the colors.
Example:
(Source code, png, hires.png, pdf)
add one or more events at the specified positions
add one or more events at the specified positions
add one or more events at the specified positions
get the color of the lines used to mark each event
get the length of the lines used to mark each event
get the offset of the lines used to mark each event
get the style of the lines used to mark each event [ ‘solid’ | ‘dashed’ | ‘dashdot’ | ‘dotted’ ]
get the width of the lines used to mark each event
get the orientation of the event line, may be: [ ‘horizontal’ | ‘vertical’ ]
return an array containing the floating-point values of the positions
True if the eventcollection is horizontal, False if vertical
set the length of the lines used to mark each event
set the offset of the lines used to mark each event
set the orientation of the event line [ ‘horizontal’ | ‘vertical’ | None ] defaults to ‘horizontal’ if not specified or None
set the positions of the events to the specified value
switch the orientation of the event line, either from vertical to horizontal or vice versus
Bases: matplotlib.collections.Collection
All parameters must be sequences or scalars; if scalars, they will be converted to sequences. The property of the ith line segment is:
prop[i % len(props)]
i.e., the properties cycle if the len of props is less than the number of segments.
a sequence of (line0, line1, line2), where:
linen = (x0, y0), (x1, y1), ... (xm, ym)
or the equivalent numpy array with two columns. Each line can be a different length.
a string or dash tuple. The dash tuple is:
(offset, onoffseq),
where onoffseq is an even length tuple of on and off ink in points.
If linewidths, colors, or antialiaseds is None, they default to their rcParams setting, in sequence form.
If offsets and transOffset are not None, then offsets are transformed by transOffset and applied after the segments have been transformed to display coordinates.
If offsets is not None but transOffset is None, then the offsets are added to the segments before any transformation. In this case, a single offset can be specified as:
offsets=(xo,yo)
and this value will be added cumulatively to each successive segment, so as to produce a set of successively offset curves.
pickradius is the tolerance for mouse clicks picking a line. The default is 5 pt.
The use of ScalarMappable is optional. If the ScalarMappable array _A is not None (ie a call to set_array() has been made), at draw time a call to scalar mappable will be made to set the colors.
Set the color(s) of the line collection. c can be a matplotlib color arg (all patches have same color), or a sequence or rgba tuples; if it is a sequence the patches will cycle through the sequence
ACCEPTS: matplotlib color arg or sequence of rgba tuples
Set the color(s) of the line collection. c can be a matplotlib color arg (all patches have same color), or a sequence or rgba tuples; if it is a sequence the patches will cycle through the sequence.
ACCEPTS: matplotlib color arg or sequence of rgba tuples
Bases: matplotlib.collections.Collection
A generic collection of patches.
This makes it easier to assign a color map to a heterogeneous collection of patches.
This also may improve plotting speed, since PatchCollection will draw faster than a large number of patches.
If any of edgecolors, facecolors, linewidths, antialiaseds are None, they default to their matplotlib.rcParams patch setting, in sequence form.
The use of ScalarMappable is optional. If the ScalarMappable matrix _A is not None (ie a call to set_array has been made), at draw time a call to scalar mappable will be made to set the face colors.
Bases: matplotlib.collections.Collection
This is the most basic Collection subclass.
paths is a sequence of matplotlib.path.Path instances.
Valid Collection keyword arguments:
- edgecolors: None
- facecolors: None
- linewidths: None
- antialiaseds: None
- offsets: None
- transOffset: transforms.IdentityTransform()
- norm: None (optional for matplotlib.cm.ScalarMappable)
- cmap: None (optional for matplotlib.cm.ScalarMappable)
offsets and transOffset are used to translate the patch after rendering (default no offsets)
If any of edgecolors, facecolors, linewidths, antialiaseds are None, they default to their matplotlib.rcParams patch setting, in sequence form.
Bases: matplotlib.collections.Collection
verts is a sequence of ( verts0, verts1, ...) where verts_i is a sequence of xy tuples of vertices, or an equivalent numpy array of shape (nv, 2).
sizes is None (default) or a sequence of floats that scale the corresponding verts_i. The scaling is applied before the Artist master transform; if the latter is an identity transform, then the overall scaling is such that if verts_i specify a unit square, then sizes_i is the area of that square in points^2. If len(sizes) < nv, the additional values will be taken cyclically from the array.
closed, when True, will explicitly close the polygon.
Valid Collection keyword arguments:
- edgecolors: None
- facecolors: None
- linewidths: None
- antialiaseds: None
- offsets: None
- transOffset: transforms.IdentityTransform()
- norm: None (optional for matplotlib.cm.ScalarMappable)
- cmap: None (optional for matplotlib.cm.ScalarMappable)
offsets and transOffset are used to translate the patch after rendering (default no offsets)
If any of edgecolors, facecolors, linewidths, antialiaseds are None, they default to their matplotlib.rcParams patch setting, in sequence form.
This allows one to delay initialization of the vertices.
This allows one to delay initialization of the vertices.
Bases: matplotlib.collections.Collection
Class for the efficient drawing of a quadrilateral mesh.
A quadrilateral mesh consists of a grid of vertices. The dimensions of this array are (meshWidth + 1, meshHeight + 1). Each vertex in the mesh has a different set of “mesh coordinates” representing its position in the topology of the mesh. For any values (m, n) such that 0 <= m <= meshWidth and 0 <= n <= meshHeight, the vertices at mesh coordinates (m, n), (m, n + 1), (m + 1, n + 1), and (m + 1, n) form one of the quadrilaterals in the mesh. There are thus (meshWidth * meshHeight) quadrilaterals in the mesh. The mesh need not be regular and the polygons need not be convex.
A quadrilateral mesh is represented by a (2 x ((meshWidth + 1) * (meshHeight + 1))) numpy array coordinates, where each row is the x and y coordinates of one of the vertices. To define the function that maps from a data point to its corresponding color, use the set_cmap() method. Each of these arrays is indexed in row-major order by the mesh coordinates of the vertex (or the mesh coordinates of the lower left vertex, in the case of the colors).
For example, the first entry in coordinates is the coordinates of the vertex at mesh coordinates (0, 0), then the one at (0, 1), then at (0, 2) .. (0, meshWidth), (1, 0), (1, 1), and so on.
shading may be ‘flat’, or ‘gouraud’
Converts a given mesh into a sequence of matplotlib.path.Path objects for easier rendering by backends that do not directly support quadmeshes.
This function is primarily of use to backend implementers.
Converts a given mesh into a sequence of triangles, each point with its own color. This is useful for experiments using draw_qouraud_triangle.
Bases: matplotlib.collections.Collection
Draw a collection of regular polygons with numsides.
gives the area of the circle circumscribing the regular polygon in points^2
Valid Collection keyword arguments:
- edgecolors: None
- facecolors: None
- linewidths: None
- antialiaseds: None
- offsets: None
- transOffset: transforms.IdentityTransform()
- norm: None (optional for matplotlib.cm.ScalarMappable)
- cmap: None (optional for matplotlib.cm.ScalarMappable)
offsets and transOffset are used to translate the patch after rendering (default no offsets)
If any of edgecolors, facecolors, linewidths, antialiaseds are None, they default to their matplotlib.rcParams patch setting, in sequence form.
Example: see examples/dynamic_collection.py for complete example:
offsets = np.random.rand(20,2)
facecolors = [cm.jet(x) for x in np.random.rand(20)]
black = (0,0,0,1)

collection = RegularPolyCollection(
    numsides=5, # a pentagon
    rotation=0, sizes=(50,),
    facecolors = facecolors,
    edgecolors = (black,),
    linewidths = (1,),
    offsets = offsets,
    transOffset = ax.transData,
    )
Bases: matplotlib.collections.RegularPolyCollection
Draw a collection of regular stars with numsides points.
gives the area of the circle circumscribing the regular polygon in points^2
Valid Collection keyword arguments:
- edgecolors: None
- facecolors: None
- linewidths: None
- antialiaseds: None
- offsets: None
- transOffset: transforms.IdentityTransform()
- norm: None (optional for matplotlib.cm.ScalarMappable)
- cmap: None (optional for matplotlib.cm.ScalarMappable)
offsets and transOffset are used to translate the patch after rendering (default no offsets)
If any of edgecolors, facecolors, linewidths, antialiaseds are None, they default to their matplotlib.rcParams patch setting, in sequence form.
Example: see examples/dynamic_collection.py for complete example:
offsets = np.random.rand(20,2)
facecolors = [cm.jet(x) for x in np.random.rand(20)]
black = (0,0,0,1)

collection = RegularPolyCollection(
    numsides=5, # a pentagon
    rotation=0, sizes=(50,),
    facecolors = facecolors,
    edgecolors = (black,),
    linewidths = (1,),
    offsets = offsets,
    transOffset = ax.transData,
    )
Bases: matplotlib.collections.Collection
Class for the efficient drawing of a triangular mesh using Gouraud shading.
A triangular mesh is a Triangulation object.
Converts a given mesh into a sequence of matplotlib.path.Path objects for easier rendering by backends that do not directly support meshes.
This function is primarily of use to backend implementers.