
(Source code, png, hires.png, pdf)
import matplotlib.pyplot as plt
from basic_units import cm
fig = plt.figure()
ax = fig.add_subplot(111)
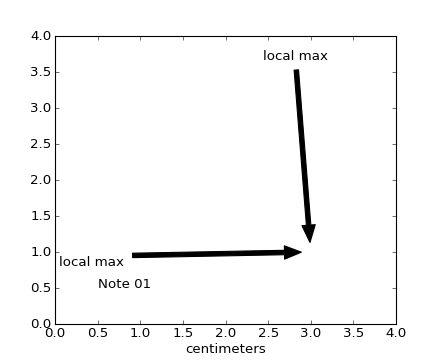
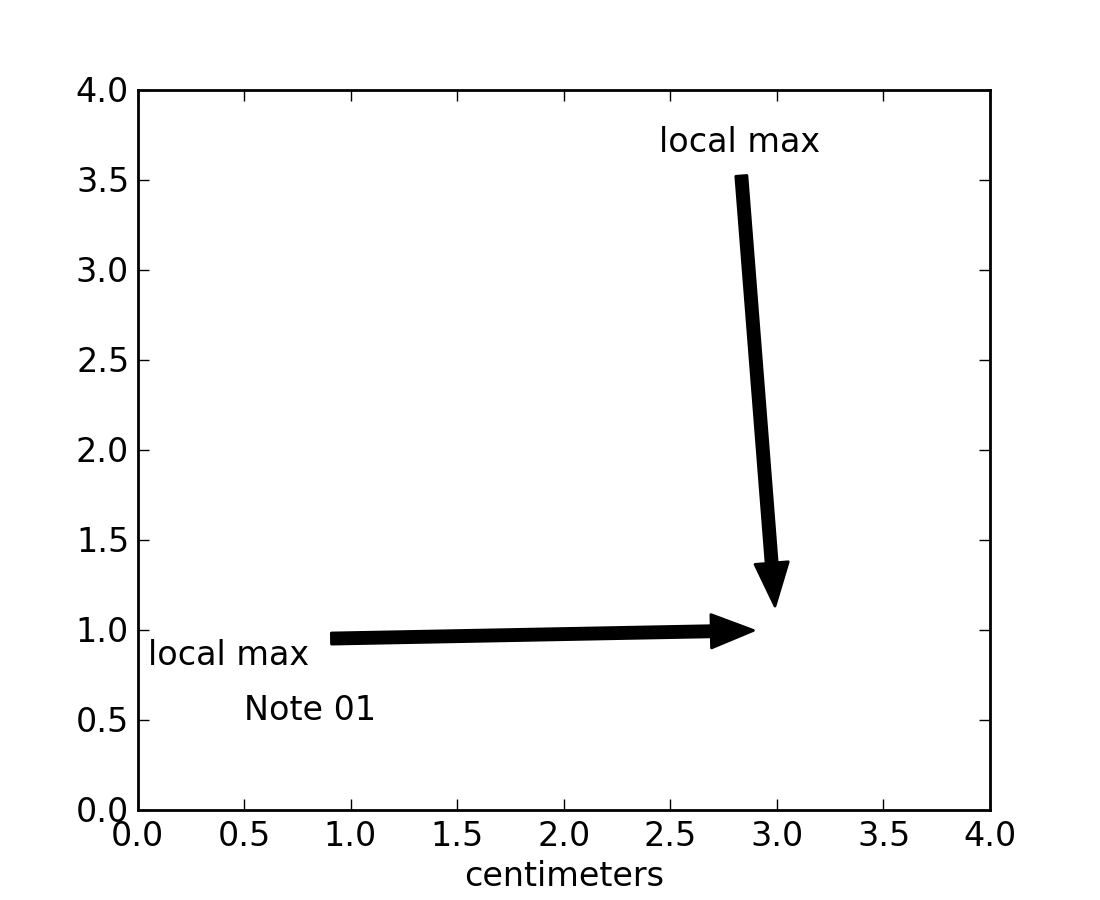
ax.annotate( "Note 01", [0.5*cm, 0.5*cm] )
# xy and text both unitized
ax.annotate('local max', xy=(3*cm, 1*cm), xycoords='data',
xytext=(0.8*cm, 0.95*cm), textcoords='data',
arrowprops=dict(facecolor='black', shrink=0.05),
horizontalalignment='right', verticalalignment='top')
# mixing units w/ nonunits
ax.annotate('local max', xy=(3*cm, 1*cm), xycoords='data',
xytext=(0.8, 0.95), textcoords='axes fraction',
arrowprops=dict(facecolor='black', shrink=0.05),
horizontalalignment='right', verticalalignment='top')
ax.set_xlim(0*cm, 4*cm)
ax.set_ylim(0*cm, 4*cm)
plt.show()
Keywords: python, matplotlib, pylab, example, codex (see Search examples)