
(Source code, png, hires.png, pdf)
#!/usr/bin/env python
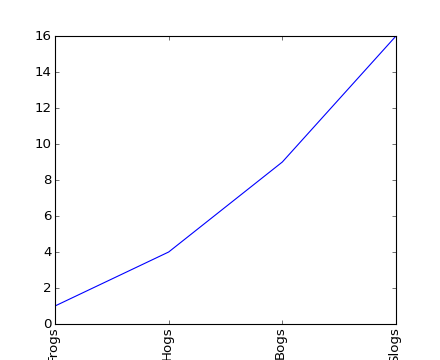
from pylab import *
plot([1,2,3,4], [1,4,9,16])
locs, labels = xticks([1,2,3,4], ['Frogs', 'Hogs', 'Bogs', 'Slogs'])
setp(labels, 'rotation', 'vertical')
show()
Keywords: python, matplotlib, pylab, example, codex (see Search examples)