
(Source code, png, hires.png, pdf)
#!/usr/bin/env python
import matplotlib
from pylab import *
from matplotlib.colors import colorConverter
#Some simple functions to generate colours.
def pastel(colour, weight=2.4):
""" Convert colour into a nice pastel shade"""
rgb = asarray(colorConverter.to_rgb(colour))
# scale colour
maxc = max(rgb)
if maxc < 1.0 and maxc > 0:
# scale colour
scale = 1.0 / maxc
rgb = rgb * scale
# now decrease saturation
total = sum(rgb)
slack = 0
for x in rgb:
slack += 1.0 - x
# want to increase weight from total to weight
# pick x s.t. slack * x == weight - total
# x = (weight - total) / slack
x = (weight - total) / slack
rgb = [c + (x * (1.0-c)) for c in rgb]
return rgb
def get_colours(n):
""" Return n pastel colours. """
base = asarray([[1,0,0], [0,1,0], [0,0,1]])
if n <= 3:
return base[0:n]
# how many new colours to we need to insert between
# red and green and between green and blue?
needed = (((n - 3) + 1) / 2, (n - 3) / 2)
colours = []
for start in (0, 1):
for x in linspace(0, 1, needed[start]+2):
colours.append((base[start] * (1.0 - x)) +
(base[start+1] * x))
return [pastel(c) for c in colours[0:n]]
axes([0.2, 0.2, 0.7, 0.6]) # leave room below the axes for the table
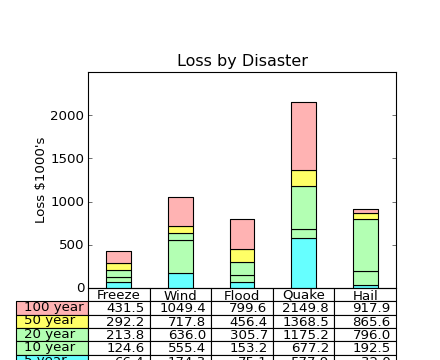
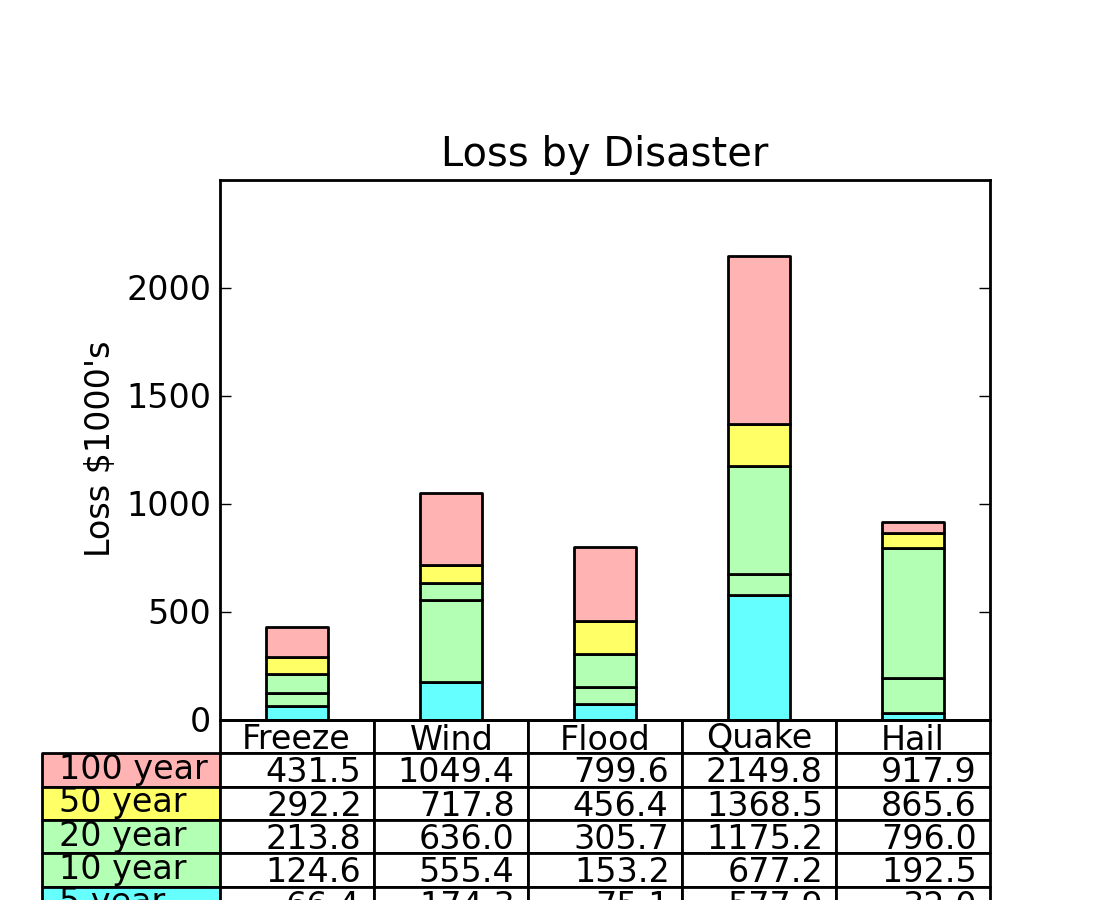
data = [[ 66386, 174296, 75131, 577908, 32015],
[ 58230, 381139, 78045, 99308, 160454],
[ 89135, 80552, 152558, 497981, 603535],
[ 78415, 81858, 150656, 193263, 69638],
[ 139361, 331509, 343164, 781380, 52269]]
colLabels = ('Freeze', 'Wind', 'Flood', 'Quake', 'Hail')
rowLabels = ['%d year' % x for x in (100, 50, 20, 10, 5)]
# Get some pastel shades for the colours
colours = get_colours(len(colLabels))
colours.reverse()
rows = len(data)
ind = arange(len(colLabels)) + 0.3 # the x locations for the groups
cellText = []
width = 0.4 # the width of the bars
yoff = array([0.0] * len(colLabels)) # the bottom values for stacked bar chart
for row in range(rows):
bar(ind, data[row], width, bottom=yoff, color=colours[row])
yoff = yoff + data[row]
cellText.append(['%1.1f' % (x/1000.0) for x in yoff])
# Add a table at the bottom of the axes
colours.reverse()
cellText.reverse()
the_table = table(cellText=cellText,
rowLabels=rowLabels, rowColours=colours,
colLabels=colLabels,
loc='bottom')
ylabel("Loss $1000's")
vals = arange(0, 2500, 500)
yticks(vals*1000, ['%d' % val for val in vals])
xticks([])
title('Loss by Disaster')
show()
Keywords: python, matplotlib, pylab, example, codex (see Search examples)