
(Source code, png, hires.png, pdf)
#!/usr/bin/env python
from pylab import *
def f(t):
s1 = cos(2*pi*t)
e1 = exp(-t)
return multiply(s1,e1)
t1 = arange(0.0, 5.0, 0.1)
t2 = arange(0.0, 5.0, 0.02)
t3 = arange(0.0, 2.0, 0.01)
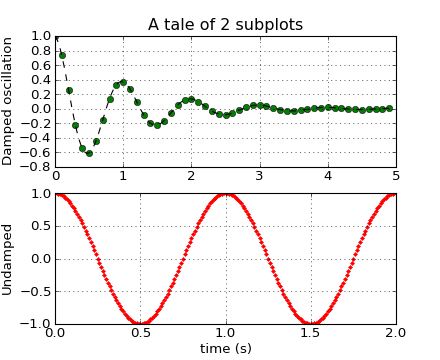
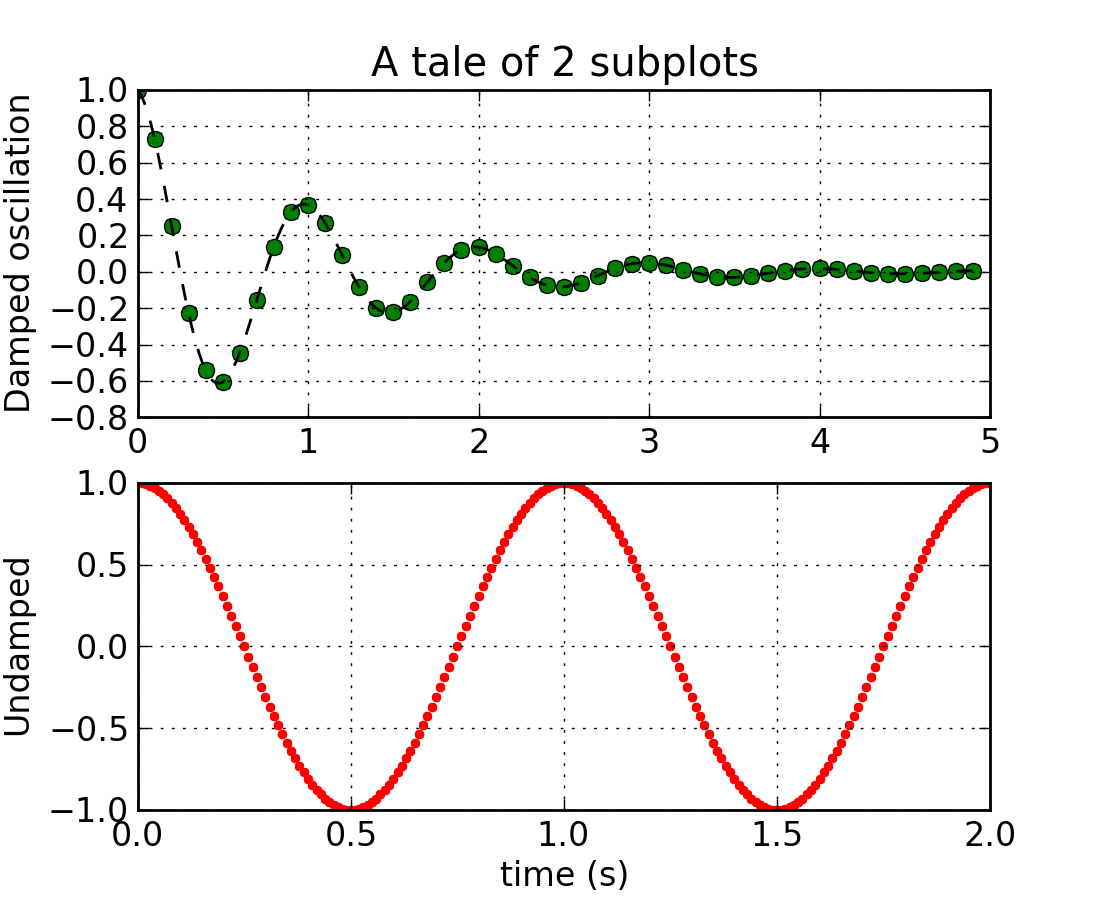
subplot(211)
l = plot(t1, f(t1), 'bo', t2, f(t2), 'k--', markerfacecolor='green')
grid(True)
title('A tale of 2 subplots')
ylabel('Damped oscillation')
subplot(212)
plot(t3, cos(2*pi*t3), 'r.')
grid(True)
xlabel('time (s)')
ylabel('Undamped')
show()
Keywords: python, matplotlib, pylab, example, codex (see Search examples)