
(Source code, png, hires.png, pdf)

"""
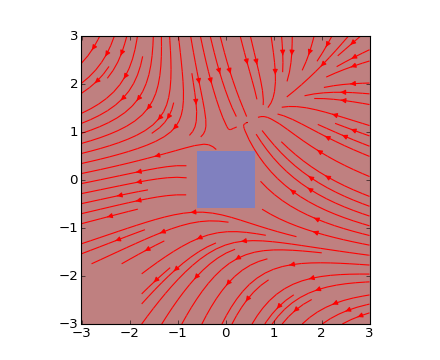
Demonstrate the use of the `streamplot` function using a masked array
and NaN values.
"""
import numpy as np
import matplotlib.pyplot as plt
w = 3
Y, X = np.mgrid[-w:w:100j, -w:w:100j]
U = -1 - X**2 + Y
V = 1 + X - Y**2
speed = np.sqrt(U*U + V*V)
mask = np.zeros(U.shape, dtype=bool)
mask[40:60, 40:60] = 1
U = np.ma.array(U, mask=mask)
U[:20, :20] = np.nan
plt.streamplot(X, Y, U, V, color='r')
plt.imshow(~mask, extent=(-w, w, -w, w), alpha=0.5, interpolation='nearest')
plt.show()
Keywords: python, matplotlib, pylab, example, codex (see Search examples)