
(Source code, png, hires.png, pdf)
#!/usr/bin/env python
from matplotlib.ticker import MultipleLocator
from pylab import *
from data_helper import get_two_stock_data
d1, p1, d2, p2 = get_two_stock_data()
ax = subplot(111)
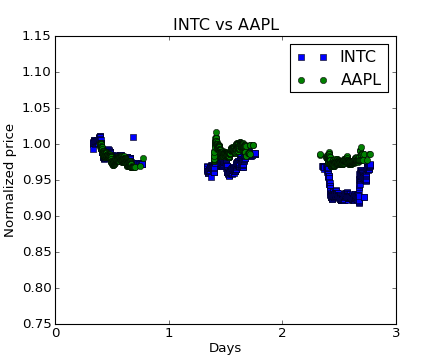
lines = plot(d1, p1, 'bs', d2, p2, 'go')
xlabel('Days')
ylabel('Normalized price')
xlim(0, 3)
ax.xaxis.set_major_locator(MultipleLocator(1))
title('INTC vs AAPL')
legend( ('INTC', 'AAPL') )
show()
Keywords: python, matplotlib, pylab, example, codex (see Search examples)