
import sys
import matplotlib.pyplot as plt
import numpy as np
from matplotlib.pyplot import show
fig = plt.figure()
x = np.linspace(0,2*np.pi,100)
y = 2*np.sin(x)
ax = fig.add_subplot(1,2,1)
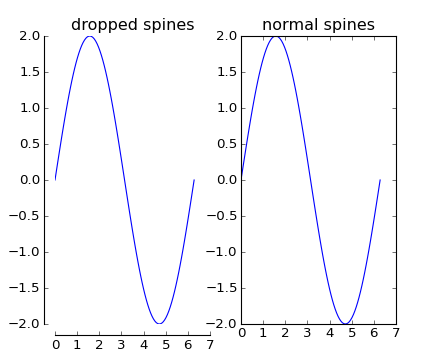
ax.set_title('dropped spines')
ax.plot(x,y)
for loc, spine in ax.spines.items():
if loc in ['left','bottom']:
spine.set_position(('outward',10)) # outward by 10 points
elif loc in ['right','top']:
spine.set_color('none') # don't draw spine
else:
raise ValueError('unknown spine location: %s'%loc)
# turn off ticks where there is no spine
ax.xaxis.set_ticks_position('bottom')
ax.yaxis.set_ticks_position('left')
ax = fig.add_subplot(1,2,2,sharex=ax)
ax.plot(x,y)
ax.set_title('normal spines')
# ----------------------------------------------------
fig = plt.figure()
x = np.linspace(-np.pi,np.pi,100)
y = 2*np.sin(x)
ax = fig.add_subplot(2,2,1)
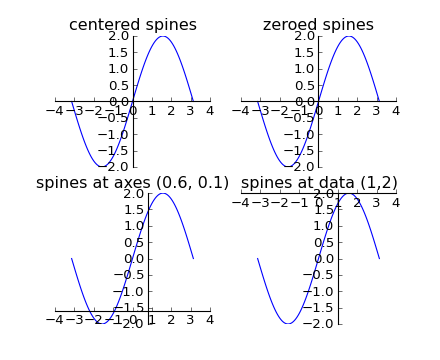
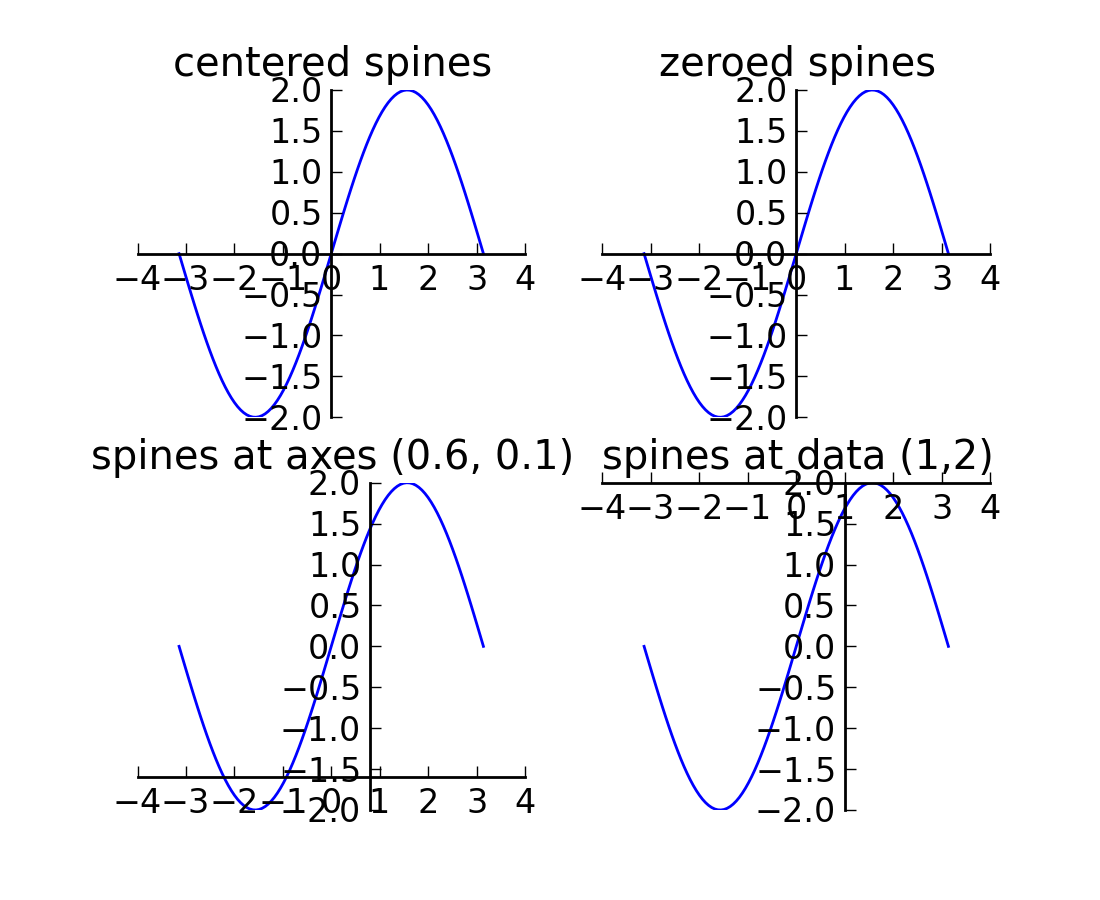
ax.set_title('centered spines')
ax.plot(x,y)
ax.spines['left'].set_position('center')
ax.spines['right'].set_color('none')
ax.spines['bottom'].set_position('center')
ax.spines['top'].set_color('none')
ax.spines['left'].set_smart_bounds(True)
ax.spines['bottom'].set_smart_bounds(True)
ax.xaxis.set_ticks_position('bottom')
ax.yaxis.set_ticks_position('left')
ax = fig.add_subplot(2,2,2)
ax.set_title('zeroed spines')
ax.plot(x,y)
ax.spines['left'].set_position('zero')
ax.spines['right'].set_color('none')
ax.spines['bottom'].set_position('zero')
ax.spines['top'].set_color('none')
ax.spines['left'].set_smart_bounds(True)
ax.spines['bottom'].set_smart_bounds(True)
ax.xaxis.set_ticks_position('bottom')
ax.yaxis.set_ticks_position('left')
ax = fig.add_subplot(2,2,3)
ax.set_title('spines at axes (0.6, 0.1)')
ax.plot(x,y)
ax.spines['left'].set_position(('axes',0.6))
ax.spines['right'].set_color('none')
ax.spines['bottom'].set_position(('axes',0.1))
ax.spines['top'].set_color('none')
ax.spines['left'].set_smart_bounds(True)
ax.spines['bottom'].set_smart_bounds(True)
ax.xaxis.set_ticks_position('bottom')
ax.yaxis.set_ticks_position('left')
ax = fig.add_subplot(2,2,4)
ax.set_title('spines at data (1,2)')
ax.plot(x,y)
ax.spines['left'].set_position(('data',1))
ax.spines['right'].set_color('none')
ax.spines['bottom'].set_position(('data',2))
ax.spines['top'].set_color('none')
ax.spines['left'].set_smart_bounds(True)
ax.spines['bottom'].set_smart_bounds(True)
ax.xaxis.set_ticks_position('bottom')
ax.yaxis.set_ticks_position('left')
# ----------------------------------------------------
def adjust_spines(ax,spines):
for loc, spine in ax.spines.items():
if loc in spines:
spine.set_position(('outward',10)) # outward by 10 points
spine.set_smart_bounds(True)
else:
spine.set_color('none') # don't draw spine
# turn off ticks where there is no spine
if 'left' in spines:
ax.yaxis.set_ticks_position('left')
else:
# no yaxis ticks
ax.yaxis.set_ticks([])
if 'bottom' in spines:
ax.xaxis.set_ticks_position('bottom')
else:
# no xaxis ticks
ax.xaxis.set_ticks([])
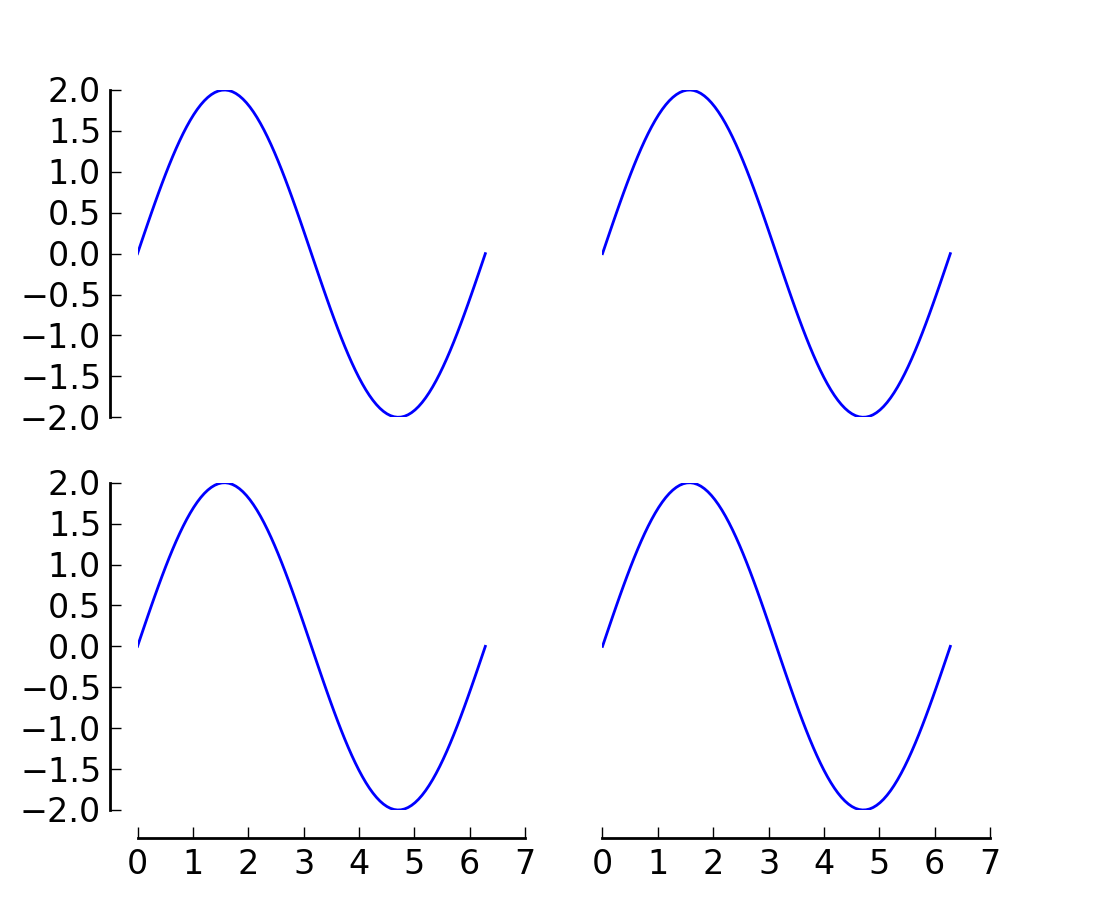
fig = plt.figure()
x = np.linspace(0,2*np.pi,100)
y = 2*np.sin(x)
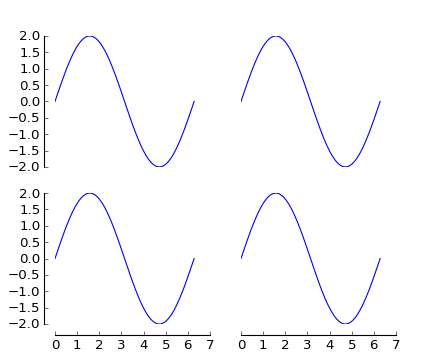
ax = fig.add_subplot(2,2,1)
ax.plot(x,y)
adjust_spines(ax,['left'])
ax = fig.add_subplot(2,2,2)
ax.plot(x,y)
adjust_spines(ax,[])
ax = fig.add_subplot(2,2,3)
ax.plot(x,y)
adjust_spines(ax,['left','bottom'])
ax = fig.add_subplot(2,2,4)
ax.plot(x,y)
adjust_spines(ax,['bottom'])
# ----------------------------------------------------
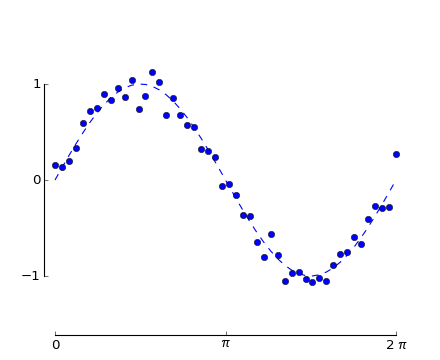
fig = plt.figure()
x = np.linspace(0,2*np.pi,50)
y = np.sin(x)
y2 = y + 0.1*np.random.normal( size=x.shape )
# plot data
ax = fig.add_subplot(1,1,1)
line1,=ax.plot(x,y,'--')
line2,=ax.plot(x,y2,'bo')
# adjust the spines
adjust_spines(ax,['left','bottom'])
# set ticks and tick labels
# x
ax.set_xlim((0,2*np.pi))
ax.set_xticks([0,np.pi,2*np.pi])
if sys.version_info[0] < 3:
pichr = unichr(0x03C0)
else:
pichr = chr(0x03C0)
ax.set_xticklabels(['0',pichr,'2 '+pichr])
# y
ax.set_yticks([-1,0,1])
# disable clipping of data points by axes range
for artist in (line1,line2):
artist.set_clip_on(False)
# adjust spine to be within ticks
ax.spines['left'].set_bounds( -1, 1 )
show()
Keywords: python, matplotlib, pylab, example, codex (see Search examples)

