
(Source code, png, hires.png, pdf)

#!/usr/bin/env python
#
# matplotlib now has a PolarAxes class and a polar function in the
# matplotlib interface. This is considered alpha and the interface
# may change as we work out how polar axes should best be integrated
#
# The only function that has been tested on polar axes is "plot" (the
# pylab interface function "polar" calls ax.plot where ax is a
# PolarAxes) -- other axes plotting functions may work on PolarAxes
# but haven't been tested and may need tweaking.
#
# you can get a PolarSubplot instance by doing, for example
#
# subplot(211, polar=True)
#
# or a PolarAxes instance by doing
# axes([left, bottom, width, height], polar=True)
#
# The view limits (eg xlim and ylim) apply to the lower left and upper
# right of the rectangular box that surrounds to polar axes. Eg if
# you have
#
# r = arange(0,1,0.01)
# theta = 2*pi*r
#
# the lower left corner is 5/4pi, sqrt(2) and the
# upper right corner is 1/4pi, sqrt(2)
#
# you could change the radial bounding box (zoom out) by setting the
# ylim (radial coordinate is the second argument to the plot command,
# as in MATLAB, though this is not advised currently because it is not
# clear to me how the axes should behave in the change of view limits.
# Please advise me if you have opinions. Likewise, the pan/zoom
# controls probably do not do what you think they do and are better
# left alone on polar axes. Perhaps I will disable them for polar
# axes unless we come up with a meaningful, useful and functional
# implementation for them.
#
# See the pylab rgrids and thetagrids functions for
# information on how to customize the grid locations and labels
import matplotlib
import numpy as np
from matplotlib.pyplot import figure, show, rc, grid
# radar green, solid grid lines
rc('grid', color='#316931', linewidth=1, linestyle='-')
rc('xtick', labelsize=15)
rc('ytick', labelsize=15)
# force square figure and square axes looks better for polar, IMO
width, height = matplotlib.rcParams['figure.figsize']
size = min(width, height)
# make a square figure
fig = figure(figsize=(size, size))
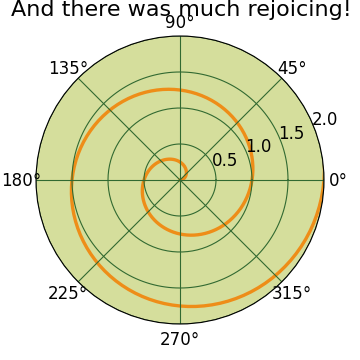
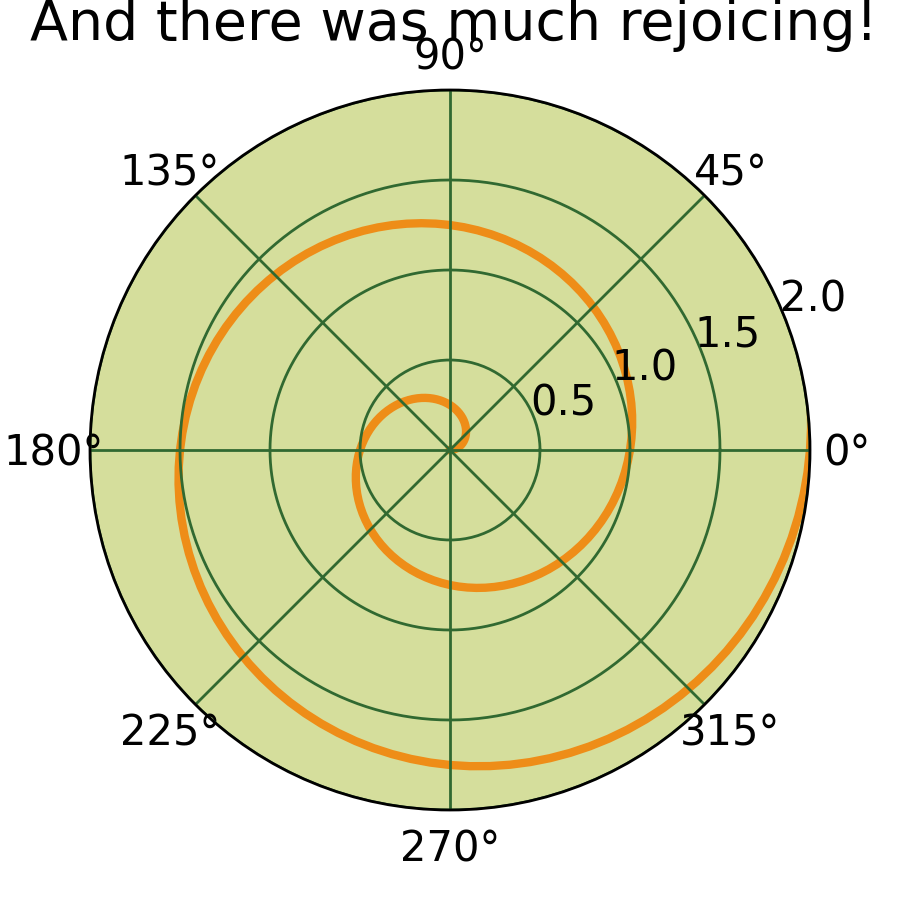
ax = fig.add_axes([0.1, 0.1, 0.8, 0.8], polar=True, axisbg='#d5de9c')
r = np.arange(0, 3.0, 0.01)
theta = 2*np.pi*r
ax.plot(theta, r, color='#ee8d18', lw=3)
ax.set_rmax(2.0)
grid(True)
ax.set_title("And there was much rejoicing!", fontsize=20)
show()
Keywords: python, matplotlib, pylab, example, codex (see Search examples)